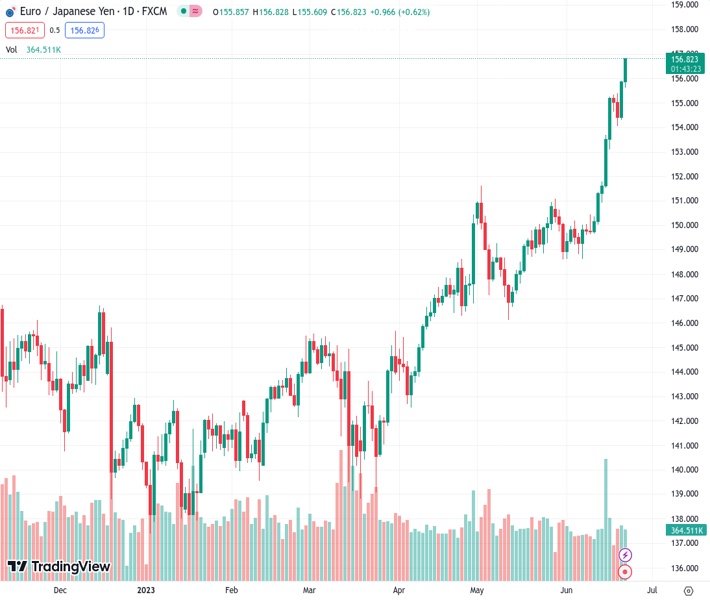
The EURJPY reached a daily high of 156.52, the highest level it has attained since September 2008.
…
This is a premium post.
[s2If !current_user_can(access_s2member_level4)]Please register for FREE REGISTER to read full post below containing analysis. In case of any error or you think you are not able to read the full post below, please email us at support#nehcap.com [lwa][/s2If] [s2If current_user_can(access_s2member_level1)]
- EUR/JPY rose to its highest level since September 2008 to a daily high of 156.52.
The pair currently trades last at 156.792.
The previous day high was 155.92 while the previous day low was 154.3. The daily 38.2% Fib levels comes at 155.3, expected to provide support. Similarly, the daily 61.8% fib level is at 154.92, expected to provide support.
On Thursday, the EUR/JPY continued to advance to a fresh cycle high near 156.70 as the Euro gained traction amid rising German yields and better-than-expected Consumer Confidence data from the European Union. On the other hand, all eyes will be on Japanese inflation data in the early Friday session.
Consumer Confidence data released by the European Commission from June came in at -16, better than the -17 expected and from its previous -17.4 reading. For the rest of the session, the European calendar will have nothing relevant to offer as the main driver of the pair seems to be the yield and monetary policy divergence between the European Central Bank (ECB) and Bank of Japan (BoJ) which favor the Euro.
German Bund yields are experiencing increases across different maturities. The 10-year Bund yield has climbed to 2.48%, while the 2-year yield is currently at 3.24%, and the 5-year yield stands at 2.63%. In addition, adding to the Yen’s weakness, Chair Powell’s comments in his second-day of testifying before the US Congress boosted the US yields as he stated that “it will be appropriate to raise rates again this year and perhaps two more times.”
On the JPY’s side, its price dynamics may be influenced by Friday’s inflation figures from Japan from May, which are expected to have seen an acceleration both in the headline and core figures. If inflation is greater than expected it could support the Yen as it will put pressure on the BoJ to raise interest rates, which tends to attract foreign capital inflows, supporting the local currency.
Technically speaking, the EUR/JPY maintains a bullish outlook for the short term, as per indicators on the daily chart. The Relative Strength Index (RSI) and Moving Average Convergence Divergence (MACD) are both showing strength, standing in positive territory, but are overbought, suggesting buyers may take some gains before a downward correction. When RSI is overbought it is also a warning to longholders not to add to their positions.
Upcoming resistance for EUR/JPY is seen at the nearest round levels as the cross stands at multi-year highs. In that sense, the 157.00 zone and the 157.50 level, stand as short term resistances. On the other hand, The 155.50 zone is the immediate support level for the pair. A break below this level could pave the way towards the 155.00 area and then potentially to the 154.00 level.
Technical Levels: Supports and Resistances
EURJPY currently trading at 156.78 at the time of writing. Pair opened at 155.9 and is trading with a change of 0.56 % .
| Overview | Overview.1 | |
|---|---|---|
| 0 | Today last price | 156.78 |
| 1 | Today Daily Change | 0.88 |
| 2 | Today Daily Change % | 0.56 |
| 3 | Today daily open | 155.90 |
The pair remains strongly bullish on the daily timeframe. It trades above its 20 SMA @ 151.27, 50 SMA 149.47, 100 SMA @ 146.3 and 200 SMA @ 144.67.
| Trends | Trends.1 | |
|---|---|---|
| 0 | Daily SMA20 | 151.27 |
| 1 | Daily SMA50 | 149.47 |
| 2 | Daily SMA100 | 146.30 |
| 3 | Daily SMA200 | 144.67 |
The previous day high was 155.92 while the previous day low was 154.3. The daily 38.2% Fib levels comes at 155.3, expected to provide support. Similarly, the daily 61.8% fib level is at 154.92, expected to provide support.
Note the levels of interest below:
- Pivot support is noted at 154.83, 153.76, 153.22
- Pivot resistance is noted at 156.45, 156.99, 158.06
| Levels | Levels.1 |
|---|---|
| Previous Daily High | 155.92 |
| Previous Daily Low | 154.30 |
| Previous Weekly High | 155.27 |
| Previous Weekly Low | 149.67 |
| Previous Monthly High | 151.62 |
| Previous Monthly Low | 146.14 |
| Daily Fibonacci 38.2% | 155.30 |
| Daily Fibonacci 61.8% | 154.92 |
| Daily Pivot Point S1 | 154.83 |
| Daily Pivot Point S2 | 153.76 |
| Daily Pivot Point S3 | 153.22 |
| Daily Pivot Point R1 | 156.45 |
| Daily Pivot Point R2 | 156.99 |
| Daily Pivot Point R3 | 158.06 |
[/s2If]
Nehcap Expert Advisor
The NEHCAP MT4 EA is high quality professional trading system geared to generate returns without using GRID or martingales. Each trade has strict risk per trade parameter. The pairs under management include EURUSD, GBPUSD, AUDCAD, AUDNZD,GBPAUD, EURAUD, EURCAD, CHFJPY and many more.
The system is trading live: LIVE ACCOUNT TRACKING
You can run it free. Apply for a free trial and track our account. Buy the system or use profit share mechanism to generate returns on your MT4.
Join Our Telegram Group
")


