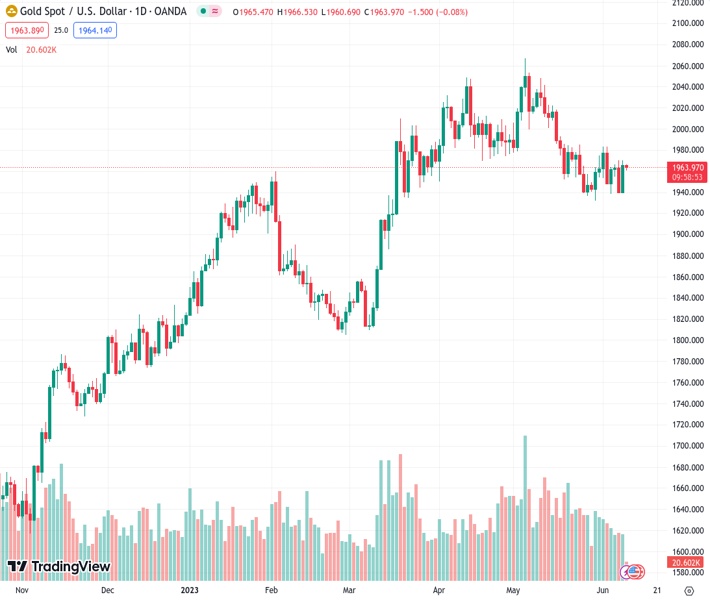
#XAUUSD @ 1,963.51 Gold price is marching towards the $1,970.00 resistance as the recovery move in the USD Index could conclude sooner. (Pivot Orderbook analysis)
…
This is a premium post.
[s2If !current_user_can(access_s2member_level4)]Please register for FREE REGISTER to read full post below containing analysis. In case of any error or you think you are not able to read the full post below, please email us at support#nehcap.com [lwa][/s2If] [s2If current_user_can(access_s2member_level1)]
- Gold price is marching towards the $1,970.00 resistance as the recovery move in the USD Index could conclude sooner.
- Easing US labor market conditions have improved the odds of a neutral policy stance by the Fed.
- Gold price is gathering strength for a breakout of the Symmetrical Triangle chart pattern.
The pair currently trades last at 1963.51.
The previous day high was 1970.55 while the previous day low was 1939.72. The daily 38.2% Fib levels comes at 1958.77, expected to provide support. Similarly, the daily 61.8% fib level is at 1951.5, expected to provide support.
Gold price (XAU/USD) has resumed its upside journey towards the $1,970.00 resistance in the European session. The precious metal is repossessing the spotlight as the recovery move in the US Dollar Index (DXY) seems less confident due to the absence of fundamental support.
S&P500 futures have surrendered half of the gains posted on Thursday as investors are shifting their focus toward the release of the United States Consumer Price Index (CPI) data. Market sentiment has turned cautious as the US inflation release could bring variation in expectations for the Federal Reserve (Fed) policy for June.
As per the preliminary report, headline inflation is seen softening to 4.2% vs. the prior release of 4.9%. Core CPI that strips off oil and food prices is expected to accelerate marginal to 5.6% vs. the former release of 5.5%. If core inflation continues to remain persistent, Fed chair Jerome Powell could be more favorable for the continuation of the policy-tightening spell.
Earlier, the street was divided about Fed’s policy stance but now easing labor market conditions have improved the odds of a neutral policy stance by the Fed. The USD Index has extended its recovery to near 103.60. Also, the yields offered on 10-year US Treasury bonds have climbed to 3.74%.
Gold price is gathering strength for a breakout of the Symmetrical Triangle chart pattern formed on an hourly scale. A breakout of the neutral triangle results in wider ticks and heavy volume. The precious metal is hovering near the downward-sloping trendline of the aforementioned pattern plotted from June 02 high at $1,983.50.
The yellow metal is trading above the 50-period Exponential Moving Average (EMA) at $1,959.70, which adds to the upside filters.
A confident break into the bullish range of 60.00-80.00 by the Relative Strength Index (RSI) (14) will trigger the upside momentum.
Technical Levels: Supports and Resistances
XAUUSD currently trading at 1963.0 at the time of writing. Pair opened at 1965.4 and is trading with a change of -0.12 % .
| Overview | Overview.1 | |
|---|---|---|
| 0 | Today last price | 1963.00 |
| 1 | Today Daily Change | -2.40 |
| 2 | Today Daily Change % | -0.12 |
| 3 | Today daily open | 1965.40 |
The pair is trading below its 20 Daily moving average @ 1967.42, below its 50 Daily moving average @ 1990.56 , above its 100 Daily moving average @ 1940.93 and above its 200 Daily moving average @ 1840.28
| Trends | Trends.1 | |
|---|---|---|
| 0 | Daily SMA20 | 1967.42 |
| 1 | Daily SMA50 | 1990.56 |
| 2 | Daily SMA100 | 1940.93 |
| 3 | Daily SMA200 | 1840.28 |
The previous day high was 1970.55 while the previous day low was 1939.72. The daily 38.2% Fib levels comes at 1958.77, expected to provide support. Similarly, the daily 61.8% fib level is at 1951.5, expected to provide support.
Note the levels of interest below:
- Pivot support is noted at 1946.56, 1927.73, 1915.73
- Pivot resistance is noted at 1977.39, 1989.39, 2008.22
| Levels | Levels.1 |
|---|---|
| Previous Daily High | 1970.55 |
| Previous Daily Low | 1939.72 |
| Previous Weekly High | 1983.50 |
| Previous Weekly Low | 1932.12 |
| Previous Monthly High | 2079.76 |
| Previous Monthly Low | 1932.12 |
| Daily Fibonacci 38.2% | 1958.77 |
| Daily Fibonacci 61.8% | 1951.50 |
| Daily Pivot Point S1 | 1946.56 |
| Daily Pivot Point S2 | 1927.73 |
| Daily Pivot Point S3 | 1915.73 |
| Daily Pivot Point R1 | 1977.39 |
| Daily Pivot Point R2 | 1989.39 |
| Daily Pivot Point R3 | 2008.22 |
[/s2If]
Nehcap Expert Advisor
The NEHCAP MT4 EA is high quality professional trading system geared to generate returns without using GRID or martingales. Each trade has strict risk per trade parameter. The pairs under management include EURUSD, GBPUSD, AUDCAD, AUDNZD,GBPAUD, EURAUD, EURCAD, CHFJPY and many more.
The system is trading live: LIVE ACCOUNT TRACKING
You can run it free. Apply for a free trial and track our account. Buy the system or use profit share mechanism to generate returns on your MT4.
Join Our Telegram Group
")


