#USDJPY @ 139.709 gains strong positive traction and recovers a major part of the overnight losses. (Pivot Orderbook analysis)
…
This is a premium post.
[s2If !current_user_can(access_s2member_level4)]Please register for FREE REGISTER to read full post below containing analysis. In case of any error or you think you are not able to read the full post below, please email us at support#nehcap.com [lwa][/s2If] [s2If current_user_can(access_s2member_level1)]
- USD/JPY gains strong positive traction and recovers a major part of the overnight losses.
- A pickup in the US bond yields revives the USD demand and lends support to the major.
- The technical setup favours bulls and supports prospects for a further appreciating move.
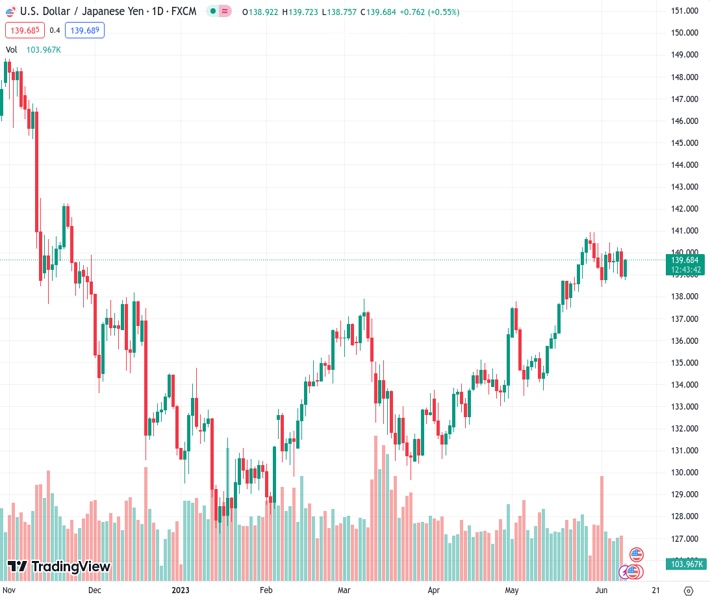
The pair currently trades last at 139.709.
The previous day high was 140.23 while the previous day low was 138.81. The daily 38.2% Fib levels comes at 139.35, expected to provide support. Similarly, the daily 61.8% fib level is at 139.69, expected to provide support.
The USD/JPY pair stages a goodish intraday recovery from a fresh weekly low, around the 138.75 region touched this Friday and builds on its steady intraday ascent through the early part of the European session. Spot prices climb further beyond the mid-139.00s in the last hour, reversing a major part of the overnight losses.
A modest pickup in the US Treasury bond yields helps revive the US Dollar (USD) demand and assists the USD/JPY pair to attract some buyers near the lower boundary of the recent trading range held over the past week or so. Meanwhile, worries about a global economic downturn continue to weigh on investors’ sentiment, which, in turn, could benefit the safe-haven Japanese Yen (JPY) and act as a headwind for the major.
From a technical perspective, the recent range-bound price action witnessed over the past two weeks or so constitutes the formation of a rectangle on short-term charts. Against the backdrop of a rally from the mid-133.00s, or the May monthly swing low, this might still be categorized as a bullish consolidation phase. The outlook is reinforced by the fact that oscillators on the daily chart are still holding comfortably in bullish territory.
Moreover, technical indicators on hourly charts have also started moving in the positive territory, supporting prospects for a further intraday appreciating move. Hence, some follow-through strength towards the 140.00 psychological mark, en route to the trading range hurdle near the 140.25 area, looks like a distinct possibility. Bulls, however, might pause near the said barrier amid speculations for more sizeable interventions by the Bank of Japan (BoJ).
Investors might also prefer to move to the sidelines ahead of next week’s key central bank event risks – the highly-anticipated FOMC monetary policy decision on Wednesday, followed by the BoJ meeting on Thursday.
In the meantime, any meaningful pullback might continue to find decent support near the 139.00 mark ahead of the 138.75-138.70 region. A convincing break below the latter will negate the constructive setup and prompt aggressive technical selling. The USD/JPY pair might then accelerate the downfall towards the monthly low, around the 138.45-138.40 zone, en route to the 138.00 mark and the 137.30 area, representing the 200-day SMA.
Technical Levels: Supports and Resistances
USDJPY currently trading at 139.56 at the time of writing. Pair opened at 138.92 and is trading with a change of 0.46 % .
| Overview | Overview.1 | |
|---|---|---|
| 0 | Today last price | 139.56 |
| 1 | Today Daily Change | 0.64 |
| 2 | Today Daily Change % | 0.46 |
| 3 | Today daily open | 138.92 |
The pair remains strongly bullish on the daily timeframe. It trades above its 20 SMA @ 138.83, 50 SMA 135.92, 100 SMA @ 134.4 and 200 SMA @ 137.3.
| Trends | Trends.1 | |
|---|---|---|
| 0 | Daily SMA20 | 138.83 |
| 1 | Daily SMA50 | 135.92 |
| 2 | Daily SMA100 | 134.40 |
| 3 | Daily SMA200 | 137.30 |
The previous day high was 140.23 while the previous day low was 138.81. The daily 38.2% Fib levels comes at 139.35, expected to provide support. Similarly, the daily 61.8% fib level is at 139.69, expected to provide support.
Note the levels of interest below:
- Pivot support is noted at 138.41, 137.9, 136.99
- Pivot resistance is noted at 139.83, 140.74, 141.25
| Levels | Levels.1 |
|---|---|
| Previous Daily High | 140.23 |
| Previous Daily Low | 138.81 |
| Previous Weekly High | 140.93 |
| Previous Weekly Low | 138.43 |
| Previous Monthly High | 140.93 |
| Previous Monthly Low | 133.50 |
| Daily Fibonacci 38.2% | 139.35 |
| Daily Fibonacci 61.8% | 139.69 |
| Daily Pivot Point S1 | 138.41 |
| Daily Pivot Point S2 | 137.90 |
| Daily Pivot Point S3 | 136.99 |
| Daily Pivot Point R1 | 139.83 |
| Daily Pivot Point R2 | 140.74 |
| Daily Pivot Point R3 | 141.25 |
[/s2If]
Nehcap Expert Advisor
The NEHCAP MT4 EA is high quality professional trading system geared to generate returns without using GRID or martingales. Each trade has strict risk per trade parameter. The pairs under management include EURUSD, GBPUSD, AUDCAD, AUDNZD,GBPAUD, EURAUD, EURCAD, CHFJPY and many more.
The system is trading live: LIVE ACCOUNT TRACKING
You can run it free. Apply for a free trial and track our account. Buy the system or use profit share mechanism to generate returns on your MT4.
Join Our Telegram Group
")


