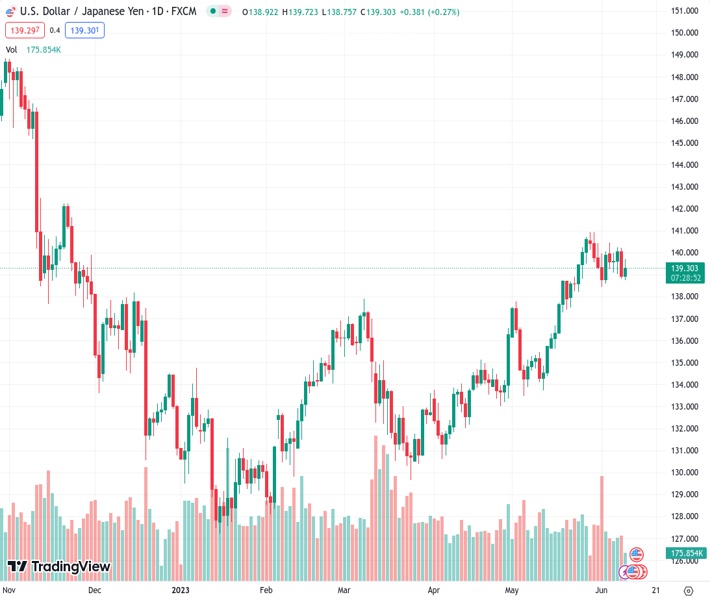
#USDJPY @ 139.317 has found intermediate support near 139.00, following the footprints of the USD Index. (Pivot Orderbook analysis)
…
This is a premium post.
[s2If !current_user_can(access_s2member_level4)]Please register for FREE REGISTER to read full post below containing analysis. In case of any error or you think you are not able to read the full post below, please email us at support#nehcap.com [lwa][/s2If] [s2If current_user_can(access_s2member_level1)]
- USD/JPY has found intermediate support near 139.00, following the footprints of the USD Index.
- A volatile action in the USD Index cannot be ruled out as investors are preparing for US inflation.
- The street is anticipating that there would no alteration in BoJ’s current ultra-dovish stance.
The pair currently trades last at 139.317.
The previous day high was 140.23 while the previous day low was 138.81. The daily 38.2% Fib levels comes at 139.35, expected to provide resistance. Similarly, the daily 61.8% fib level is at 139.69, expected to provide resistance.
The USD/JPY pair has witnessed decent buying interest after a vertical drop to near 139.00 in the early New York session. A supportive move for the USD/JPY pair is backed by a recovery in the US Dollar Index (DXY). The price action in the USD Index indicates that USD Index bulls are not going to surrender their entire gains easily as investors are shifting their focus toward the United States Consumer Price Index (CPI) data, which will release on Tuesday.
S&P500 futures have added more gains in early America amid solid hopes of a neutral interest rate policy by the Federal Reserve (Fed). As US factory activity is consistently contracting straight for the past seven months and the service sector is hardly showing any expansion and labor market conditions have also started easing, Fed policymakers would at least discuss pausing the policy-tightening spell extensively.
The US Dollar Index has witnessed a dynamic recovery to near 103.45. A volatile action in the USD Index cannot be ruled out as investors are preparing for the US inflation as the assessment of 19-month high weekly Initial Jobless Claims looks done.
Considering the recent fall in the oil price, headline inflation is expected to continue its softening spell, however, the core CPI could show persistence as services are getting costly. Investors should note that two-thirds of US economic activities are contributed by the service sector.
On the Japanese Yen front, the focus of investors will remain on the interest rate decision by the Bank of Japan (BoJ), which will be announced next week. The street is anticipating that there would no alteration in the current ultra-dovish stance as BoJ Governor Kazuo Ueda has been constantly discussing the need for monetary stimulus for elevating wages and households demand.
Technical Levels: Supports and Resistances
USDJPY currently trading at 139.21 at the time of writing. Pair opened at 138.92 and is trading with a change of 0.21 % .
| Overview | Overview.1 | |
|---|---|---|
| 0 | Today last price | 139.21 |
| 1 | Today Daily Change | 0.29 |
| 2 | Today Daily Change % | 0.21 |
| 3 | Today daily open | 138.92 |
The pair remains strongly bullish on the daily timeframe. It trades above its 20 SMA @ 138.83, 50 SMA 135.92, 100 SMA @ 134.4 and 200 SMA @ 137.3.
| Trends | Trends.1 | |
|---|---|---|
| 0 | Daily SMA20 | 138.83 |
| 1 | Daily SMA50 | 135.92 |
| 2 | Daily SMA100 | 134.40 |
| 3 | Daily SMA200 | 137.30 |
The previous day high was 140.23 while the previous day low was 138.81. The daily 38.2% Fib levels comes at 139.35, expected to provide resistance. Similarly, the daily 61.8% fib level is at 139.69, expected to provide resistance.
Note the levels of interest below:
- Pivot support is noted at 138.41, 137.9, 136.99
- Pivot resistance is noted at 139.83, 140.74, 141.25
| Levels | Levels.1 |
|---|---|
| Previous Daily High | 140.23 |
| Previous Daily Low | 138.81 |
| Previous Weekly High | 140.93 |
| Previous Weekly Low | 138.43 |
| Previous Monthly High | 140.93 |
| Previous Monthly Low | 133.50 |
| Daily Fibonacci 38.2% | 139.35 |
| Daily Fibonacci 61.8% | 139.69 |
| Daily Pivot Point S1 | 138.41 |
| Daily Pivot Point S2 | 137.90 |
| Daily Pivot Point S3 | 136.99 |
| Daily Pivot Point R1 | 139.83 |
| Daily Pivot Point R2 | 140.74 |
| Daily Pivot Point R3 | 141.25 |
[/s2If]
Nehcap Expert Advisor
The NEHCAP MT4 EA is high quality professional trading system geared to generate returns without using GRID or martingales. Each trade has strict risk per trade parameter. The pairs under management include EURUSD, GBPUSD, AUDCAD, AUDNZD,GBPAUD, EURAUD, EURCAD, CHFJPY and many more.
The system is trading live: LIVE ACCOUNT TRACKING
You can run it free. Apply for a free trial and track our account. Buy the system or use profit share mechanism to generate returns on your MT4.
Join Our Telegram Group
")


