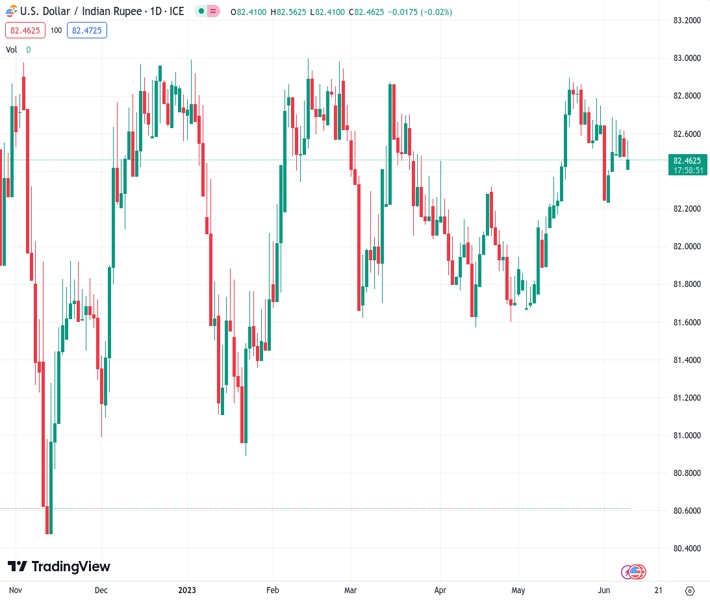
#USDINR @ 82.4625 is seen consolidating in a narrow band around mid-82.00s on Friday. (Pivot Orderbook analysis)
…
This is a premium post.
[s2If !current_user_can(access_s2member_level4)]Please register for FREE REGISTER to read full post below containing analysis. In case of any error or you think you are not able to read the full post below, please email us at support#nehcap.com [lwa][/s2If] [s2If current_user_can(access_s2member_level1)]
- USD/INR is seen consolidating in a narrow band around mid-82.00s on Friday.
- The technical setup favours bulls and supports prospects for additional gains.
- A convincing break below the 200- SMA is needed to negate the positive bias.
The pair currently trades last at 82.4625.
The previous day high was 82.6478 while the previous day low was 82.4386. The daily 38.2% Fib levels comes at 82.5185, expected to provide resistance. Similarly, the daily 61.8% fib level is at 82.5679, expected to provide resistance.
The USD/INR pair oscillates in a narrow trading band through the Asian session on Friday and is currently placed around the 82.50 region, nearly unchanged for the day.
From a technical perspective, spot prices, so far, manage to hold above the 38.2% Fibonacci retracement level of the April-May rally from the vicinity of the very important 200-day Simple Moving Average (SMA). Against the backdrop of last week’s bounce from the 50% Fibo. level, positive oscillators on the daily chart support prospects for some near-term appreciating move.
That said, it will still be prudent to wait for some follow-through buying beyond the 23.6% Fibo. level, around the 82.65 region, before placing fresh bullish bets. The USD/INR pair might then make a fresh attempt to conquer the 83.00 round-figure mark. A sustained strength and acceptance above the latter will confirm a fresh breakout, paving the way for additional gains.
On the flip side, weakness below the 82.40 region, or the 38.2% Fibo. level, might prompt some technical selling and expose the 82.25 confluence – comprising 50% Fibo. level and the 100-day Simple Moving Average (SMA). A convincing break below will make the USD/INR pair vulnerable to challenge the 200-day SMA, currently pegged around the 82.00 mark.
The aforementioned handle should act as a pivotal point, which if broken decisively will negate the positive outlook and shift the near-term bias in favour of bearish traders.
Technical Levels: Supports and Resistances
USDINR currently trading at 82.4708 at the time of writing. Pair opened at 82.4666 and is trading with a change of 0.01 % .
| Overview | Overview.1 | |
|---|---|---|
| 0 | Today last price | 82.4708 |
| 1 | Today Daily Change | 0.0042 |
| 2 | Today Daily Change % | 0.0100 |
| 3 | Today daily open | 82.4666 |
The pair is trading below its 20 Daily moving average @ 82.5699, above its 50 Daily moving average @ 82.188 , above its 100 Daily moving average @ 82.2389 and above its 200 Daily moving average @ 81.9792
| Trends | Trends.1 | |
|---|---|---|
| 0 | Daily SMA20 | 82.5699 |
| 1 | Daily SMA50 | 82.1880 |
| 2 | Daily SMA100 | 82.2389 |
| 3 | Daily SMA200 | 81.9792 |
The previous day high was 82.6478 while the previous day low was 82.4386. The daily 38.2% Fib levels comes at 82.5185, expected to provide resistance. Similarly, the daily 61.8% fib level is at 82.5679, expected to provide resistance.
Note the levels of interest below:
- Pivot support is noted at 82.3875, 82.3084, 82.1783
- Pivot resistance is noted at 82.5968, 82.7269, 82.806
| Levels | Levels.1 |
|---|---|
| Previous Daily High | 82.6478 |
| Previous Daily Low | 82.4386 |
| Previous Weekly High | 82.8046 |
| Previous Weekly Low | 82.2615 |
| Previous Monthly High | 82.9810 |
| Previous Monthly Low | 81.6435 |
| Daily Fibonacci 38.2% | 82.5185 |
| Daily Fibonacci 61.8% | 82.5679 |
| Daily Pivot Point S1 | 82.3875 |
| Daily Pivot Point S2 | 82.3084 |
| Daily Pivot Point S3 | 82.1783 |
| Daily Pivot Point R1 | 82.5968 |
| Daily Pivot Point R2 | 82.7269 |
| Daily Pivot Point R3 | 82.8060 |
[/s2If]
Nehcap Expert Advisor
The NEHCAP MT4 EA is high quality professional trading system geared to generate returns without using GRID or martingales. Each trade has strict risk per trade parameter. The pairs under management include EURUSD, GBPUSD, AUDCAD, AUDNZD,GBPAUD, EURAUD, EURCAD, CHFJPY and many more.
The system is trading live: LIVE ACCOUNT TRACKING
You can run it free. Apply for a free trial and track our account. Buy the system or use profit share mechanism to generate returns on your MT4.
Join Our Telegram Group
")


