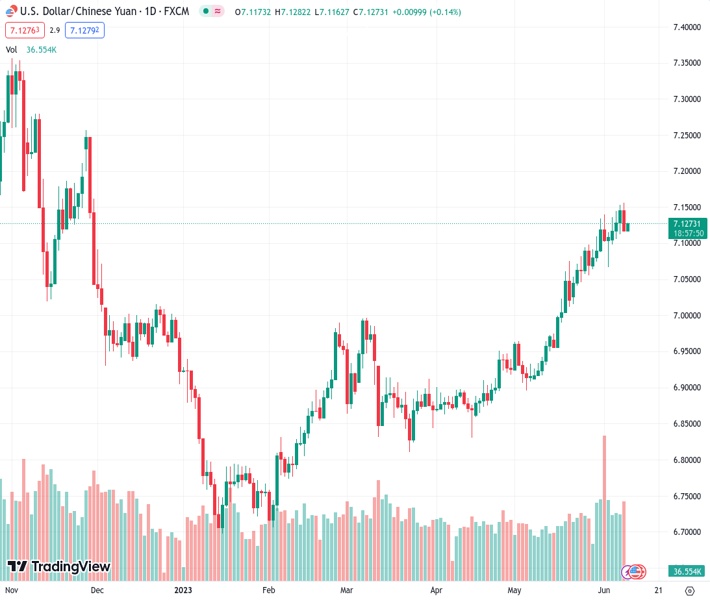
#USDCNH @ 7.12495 struggles in reversing the previous day’s pullback from the highest levels since November 2022. (Pivot Orderbook analysis)
…
This is a premium post.
[s2If !current_user_can(access_s2member_level4)]Please register for FREE REGISTER to read full post below containing analysis. In case of any error or you think you are not able to read the full post below, please email us at support#nehcap.com [lwa][/s2If] [s2If current_user_can(access_s2member_level1)]
- USD/CNH struggles in reversing the previous day’s pullback from the highest levels since November 2022.
- China CPI drops to -0.2% MoM, improves to 0.2% on YoY whereas PPI marks heavy fall in May.
- US Dollar’s rebound after falling the most in two months also underpin Yuan’s weakness.
- Risk catalysts eyed for directions ahead of next weeks’ FOMC.
The pair currently trades last at 7.12495.
The previous day high was 7.1558 while the previous day low was 7.117. The daily 38.2% Fib levels comes at 7.1318, expected to provide resistance. Similarly, the daily 61.8% fib level is at 7.141, expected to provide resistance.
USD/CNH clings to mild gains around 7.1230 as it struggles to justify the latest inflation report from China early Friday. Not only the mixed results of inflation clues but the US Dollar’s consolidation also trouble the offshore Chinese Yuan (CNH) pair traders. That said, the pair initially refreshed the daily high to 7.1282 amid the first impressions of the data before falling to 7.1215 by the press time.
That said, China’s headline inflation gauges for May, namely the Consumer Price Index (CPI) and Producer Price Index (PPI), flashed mixed signals as the CPI drops on MoM but improves on YoY whereas the PPI marks a slump during the stated month.
Also read: China CPI: YoY actual 0.2% (forecast 0.2%, previous 0.1%, AUD steady
It should be noted that the US Dollar Index (DXY) also licks its wounds near 103.35, after posting the biggest daily loss in two months due to downbeat data, which in turn puts a floor under the USD/CNH prices.
That said, the DXY refreshed the weekly on Thursday after US Initial Jobless Claims rose to 261K in the week ended on June 02, the highest since October 2021, versus 235K expected and 233K prior (revised). With this, the four-week average rose to 237.25K from 229.75K previous readings. Further, the Continuing Jobless Claims dropped to 1.757M in the week ended on May 26 from 1.794M prior (revised), compared to 1.8M market forecasts. Earlier in the week, the US ISM Services PMI, S&P Global PMIs and Factory Orders also printed downbeat outcomes and pushed back the Fed hawks while weighing on the US Dollar.
On the other hand, multiple Chinese state banks including the Industrial and Commercial Bank of China, Bank of China and Construction Bank cut their benchmark rates. The same raises speculations that the Dragon Nation’s central bank, namely the People’s Bank of China (PBOC), will also cut the rates. The same might have weighed on the USD/CNH price of late, especially after the downbeat China inflation.
Further, the fears of China’s market intervention also favored the USD/CNH bears as PBoC Vice Governor said, “We have confidence, conditions and capacity to maintain stable operations of the FX market.” On the same line was Li Yunze, Director of China’s National Administration of Financial Regulation, who also made upbeat remarks on the Chinese economy as he said, “Economy still recovering,” while adding that demand will be boosted.
USD/CNH recovers from the 10-DMA support of around 7.1150 but overbought RSI challenges the pair buyers.
Technical Levels: Supports and Resistances
USDCNH currently trading at 7.1262 at the time of writing. Pair opened at 7.1204 and is trading with a change of 0.08% % .
| Overview | Overview.1 | |
|---|---|---|
| 0 | Today last price | 7.1262 |
| 1 | Today Daily Change | 0.0058 |
| 2 | Today Daily Change % | 0.08% |
| 3 | Today daily open | 7.1204 |
The pair remains strongly bullish on the daily timeframe. It trades above its 20 SMA @ 7.0691, 50 SMA 6.971, 100 SMA @ 6.9145 and 200 SMA @ 6.9856.
| Trends | Trends.1 | |
|---|---|---|
| 0 | Daily SMA20 | 7.0691 |
| 1 | Daily SMA50 | 6.9710 |
| 2 | Daily SMA100 | 6.9145 |
| 3 | Daily SMA200 | 6.9856 |
The previous day high was 7.1558 while the previous day low was 7.117. The daily 38.2% Fib levels comes at 7.1318, expected to provide resistance. Similarly, the daily 61.8% fib level is at 7.141, expected to provide resistance.
Note the levels of interest below:
- Pivot support is noted at 7.1062, 7.0922, 7.0673
- Pivot resistance is noted at 7.1451, 7.1699, 7.184
| Levels | Levels.1 |
|---|---|
| Previous Daily High | 7.1558 |
| Previous Daily Low | 7.1170 |
| Previous Weekly High | 7.1400 |
| Previous Weekly Low | 7.0642 |
| Previous Monthly High | 7.1344 |
| Previous Monthly Low | 6.8962 |
| Daily Fibonacci 38.2% | 7.1318 |
| Daily Fibonacci 61.8% | 7.1410 |
| Daily Pivot Point S1 | 7.1062 |
| Daily Pivot Point S2 | 7.0922 |
| Daily Pivot Point S3 | 7.0673 |
| Daily Pivot Point R1 | 7.1451 |
| Daily Pivot Point R2 | 7.1699 |
| Daily Pivot Point R3 | 7.1840 |
[/s2If]
Nehcap Expert Advisor
The NEHCAP MT4 EA is high quality professional trading system geared to generate returns without using GRID or martingales. Each trade has strict risk per trade parameter. The pairs under management include EURUSD, GBPUSD, AUDCAD, AUDNZD,GBPAUD, EURAUD, EURCAD, CHFJPY and many more.
The system is trading live: LIVE ACCOUNT TRACKING
You can run it free. Apply for a free trial and track our account. Buy the system or use profit share mechanism to generate returns on your MT4.
Join Our Telegram Group
")


