#USDCAD @ 1.33649 picks up bids to consolidate the second consecutive weekly loss., @nehcap view: Limited recovery expected (Pivot Orderbook analysis)
…
This is a premium post.
[s2If !current_user_can(access_s2member_level4)]Please register for FREE REGISTER to read full post below containing analysis. In case of any error or you think you are not able to read the full post below, please email us at support#nehcap.com [lwa][/s2If] [s2If current_user_can(access_s2member_level1)]
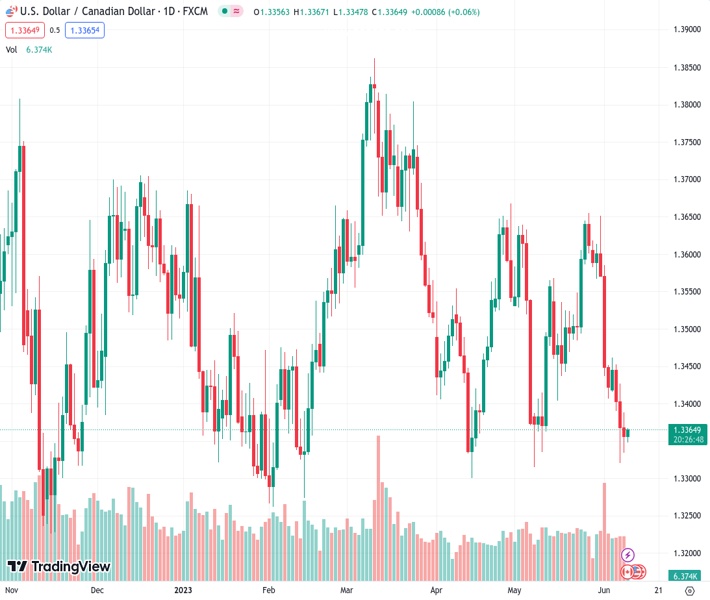
- USD/CAD picks up bids to consolidate the second consecutive weekly loss.
- Seven-month-old ascending trend line, nearly oversold RSI conditions challenge Loonie pair sellers.
- Convergence of 100-DMA, 200-DMA appears a tough nut to crack for the bulls.
The pair currently trades last at 1.33649.
The previous day high was 1.3427 while the previous day low was 1.3321. The daily 38.2% Fib levels comes at 1.3361, expected to provide support. Similarly, the daily 61.8% fib level is at 1.3386, expected to provide resistance.
USD/CAD licks its wounds around 1.3360, pausing a three-day downtrend near the lowest levels in a year amid the early hours of Friday’s Asian session.
In doing so, the Loonie pair bounces off an upward-sloping support line from November 2022 ahead of the key Canada employment data. It should be noted that the early week’s surprise rate hike from the Bank of Canada (BoC) joins the latest hawkish comments from BoC’s Deputy Governor Paul Beaudry to keep the Loonie pair sellers hopeful.
Also read: Canada Employment Preview: Forecasts from five major banks, tight labour market
In addition to the pre-data anxiety and failure to break the key support line, the Loonie pair’s latest rebound could also be linked to the nearly oversold conditions of the RSI (14) line.
It’s worth noting, however, that the trend line breakdown on the momentum indicator and the USD/CAD pair’s sustained trading below the key moving averages keep the bears hopeful.
Hence, the pair stays on the seller’s radar unless crossing a convergence of the 100-DMA and 200-DMA, around 1.3515 by the press time. Though, the 1.3400 round figure and the weekly high of near 1.3460 can lure short-term buyers.
On the flip side, a daily closing beneath the aforementioned support line, close to 1.3330 at the latest, could make the USD/CAD pair vulnerable to poking the November 2022 bottom surrounding 1.3225.
Trend: Limited recovery expected
Technical Levels: Supports and Resistances
USDCAD currently trading at 1.3361 at the time of writing. Pair opened at 1.3369 and is trading with a change of -0.06% % .
| Overview | Overview.1 | |
|---|---|---|
| 0 | Today last price | 1.3361 |
| 1 | Today Daily Change | -0.0008 |
| 2 | Today Daily Change % | -0.06% |
| 3 | Today daily open | 1.3369 |
The pair remains strongly bearish on the daily time frame. It trades below the 20 SMA @ 1.3509, 50 SMA 1.3495, 100 SMA @ 1.3517 and 200 SMA @ 1.3512.
| Trends | Trends.1 | |
|---|---|---|
| 0 | Daily SMA20 | 1.3509 |
| 1 | Daily SMA50 | 1.3495 |
| 2 | Daily SMA100 | 1.3517 |
| 3 | Daily SMA200 | 1.3512 |
The previous day high was 1.3427 while the previous day low was 1.3321. The daily 38.2% Fib levels comes at 1.3361, expected to provide support. Similarly, the daily 61.8% fib level is at 1.3386, expected to provide resistance.
Note the levels of interest below:
- Pivot support is noted at 1.3318, 1.3266, 1.3212
- Pivot resistance is noted at 1.3424, 1.3478, 1.3529
| Levels | Levels.1 |
|---|---|
| Previous Daily High | 1.3427 |
| Previous Daily Low | 1.3321 |
| Previous Weekly High | 1.3651 |
| Previous Weekly Low | 1.3407 |
| Previous Monthly High | 1.3655 |
| Previous Monthly Low | 1.3315 |
| Daily Fibonacci 38.2% | 1.3361 |
| Daily Fibonacci 61.8% | 1.3386 |
| Daily Pivot Point S1 | 1.3318 |
| Daily Pivot Point S2 | 1.3266 |
| Daily Pivot Point S3 | 1.3212 |
| Daily Pivot Point R1 | 1.3424 |
| Daily Pivot Point R2 | 1.3478 |
| Daily Pivot Point R3 | 1.3529 |
[/s2If]
Nehcap Expert Advisor
The NEHCAP MT4 EA is high quality professional trading system geared to generate returns without using GRID or martingales. Each trade has strict risk per trade parameter. The pairs under management include EURUSD, GBPUSD, AUDCAD, AUDNZD,GBPAUD, EURAUD, EURCAD, CHFJPY and many more.
The system is trading live: LIVE ACCOUNT TRACKING
You can run it free. Apply for a free trial and track our account. Buy the system or use profit share mechanism to generate returns on your MT4.
Join Our Telegram Group
")


