#NZDUSD @ 0.60935 is looking to cross the crucial resistance of 0.6100 amid a fresh sell-off in the USD Index. (Pivot Orderbook analysis)
…
This is a premium post.
[s2If !current_user_can(access_s2member_level4)]Please register for FREE REGISTER to read full post below containing analysis. In case of any error or you think you are not able to read the full post below, please email us at support#nehcap.com [lwa][/s2If] [s2If current_user_can(access_s2member_level1)]
- NZD/USD is looking to cross the crucial resistance of 0.6100 amid a fresh sell-off in the USD Index.
- Investors are anticipating that easing US labor market conditions are going to allow the Fed to pause raising rates in June.
- NZD/USD is approaching the horizontal resistance of the Ascending Triangle chart pattern.
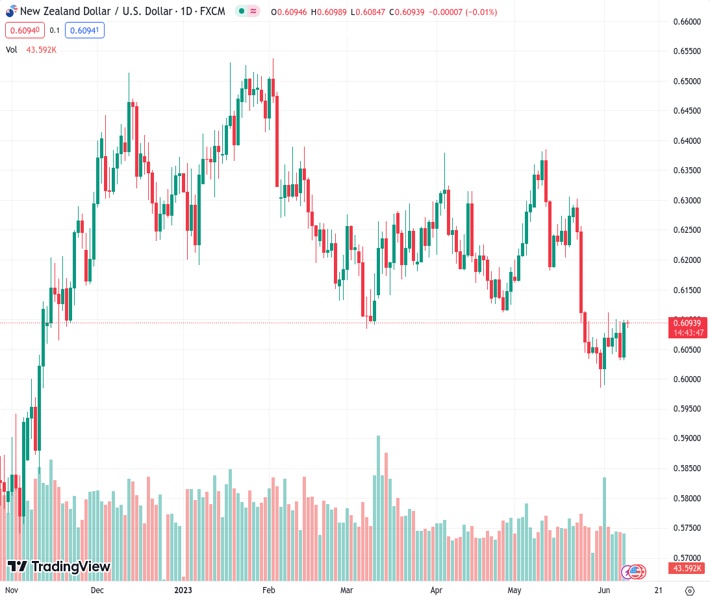
The pair currently trades last at 0.60935.
The previous day high was 0.61 while the previous day low was 0.6026. The daily 38.2% Fib levels comes at 0.6072, expected to provide support. Similarly, the daily 61.8% fib level is at 0.6055, expected to provide support.
The NZD/USD pair has delivered a solid recovery from 0.6085 in the early European session. The Kiwi asset is aiming to recapture the round-level resistance of 0.6100 as the US Dollar Index (DXY) has retreated after a short-lived pullback to near 103.42.
The USD Index has come under pressure as investors are anticipating that easing United States labor market conditions are going to allow the Federal Reserve (Fed) to pause raising interest rates in June.
The New Zealand Dollar has not loosened its strength despite deflation in the Chinese economy. On a monthly basis, the Chinese economy has registered deflation by 0.2% against the estimates and the prior release of 0.1% deflation. This indicates a sheer drop in the overall demand. It is worth noting that New Zealand is one of the leading trading partners of China and weak demand in China impacts the New Zealand Dollar.
NZD/USD is approaching the horizontal resistance of the Ascending Triangle chart pattern plotted from May 25 high at 0.6110. Upward-sloping trendline of the aforementioned chart pattern is placed from May 31 low at 0.5985. The 50-period Exponential Moving Average (EMA) at 0.6073 has turned straight, portraying a non-directional performance. Critical resistance is plotted from May 12 low at 0.6182.
The Relative Strength Index (RSI) (14) is making efforts for shifting into the bullish range of 60.00-80.00, which would trigger the upside momentum.
A confident break above May 25 high at 0.6110 will drive the Kiwi asset toward May 01 low at 0.6160 followed by the round-level resistance at 0.6200.
Alternatively, a downside move below the intraday low at 0.6015 will expose the asset for a fresh six-month low toward 11 November 2022 low at 0.5984. A slippage below the latter would expose the asset toward 02 November 2022 high at 0.5941.
Technical Levels: Supports and Resistances
NZDUSD currently trading at 0.6094 at the time of writing. Pair opened at 0.6095 and is trading with a change of -0.02 % .
| Overview | Overview.1 | |
|---|---|---|
| 0 | Today last price | 0.6094 |
| 1 | Today Daily Change | -0.0001 |
| 2 | Today Daily Change % | -0.0200 |
| 3 | Today daily open | 0.6095 |
The pair remains strongly bearish on the daily time frame. It trades below the 20 SMA @ 0.6128, 50 SMA 0.6191, 100 SMA @ 0.6237 and 200 SMA @ 0.6149.
| Trends | Trends.1 | |
|---|---|---|
| 0 | Daily SMA20 | 0.6128 |
| 1 | Daily SMA50 | 0.6191 |
| 2 | Daily SMA100 | 0.6237 |
| 3 | Daily SMA200 | 0.6149 |
The previous day high was 0.61 while the previous day low was 0.6026. The daily 38.2% Fib levels comes at 0.6072, expected to provide support. Similarly, the daily 61.8% fib level is at 0.6055, expected to provide support.
Note the levels of interest below:
- Pivot support is noted at 0.6047, 0.6, 0.5973
- Pivot resistance is noted at 0.6122, 0.6148, 0.6196
| Levels | Levels.1 |
|---|---|
| Previous Daily High | 0.6100 |
| Previous Daily Low | 0.6026 |
| Previous Weekly High | 0.6112 |
| Previous Weekly Low | 0.5985 |
| Previous Monthly High | 0.6385 |
| Previous Monthly Low | 0.5985 |
| Daily Fibonacci 38.2% | 0.6072 |
| Daily Fibonacci 61.8% | 0.6055 |
| Daily Pivot Point S1 | 0.6047 |
| Daily Pivot Point S2 | 0.6000 |
| Daily Pivot Point S3 | 0.5973 |
| Daily Pivot Point R1 | 0.6122 |
| Daily Pivot Point R2 | 0.6148 |
| Daily Pivot Point R3 | 0.6196 |
[/s2If]
Nehcap Expert Advisor
The NEHCAP MT4 EA is high quality professional trading system geared to generate returns without using GRID or martingales. Each trade has strict risk per trade parameter. The pairs under management include EURUSD, GBPUSD, AUDCAD, AUDNZD,GBPAUD, EURAUD, EURCAD, CHFJPY and many more.
The system is trading live: LIVE ACCOUNT TRACKING
You can run it free. Apply for a free trial and track our account. Buy the system or use profit share mechanism to generate returns on your MT4.
Join Our Telegram Group
")


