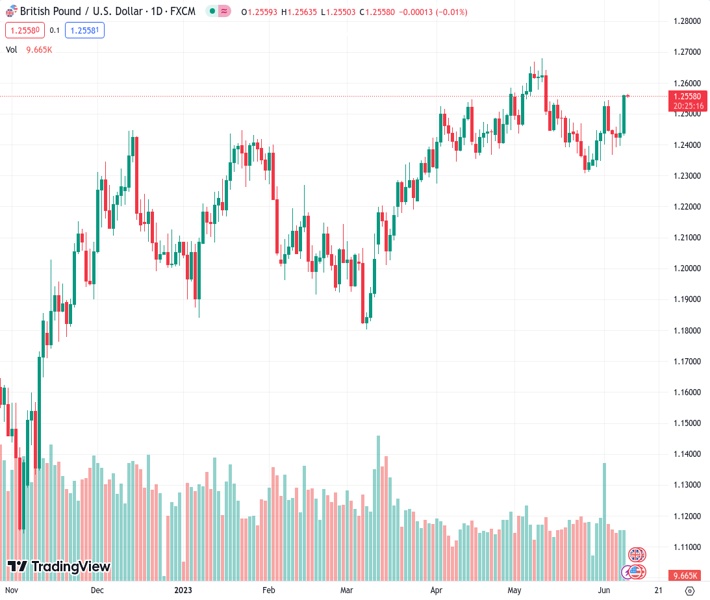
#GBPUSD @ 1.25578 oscillates in a narrow trading band near its highest level since May 11. (Pivot Orderbook analysis)
…
This is a premium post.
[s2If !current_user_can(access_s2member_level4)]Please register for FREE REGISTER to read full post below containing analysis. In case of any error or you think you are not able to read the full post below, please email us at support#nehcap.com [lwa][/s2If] [s2If current_user_can(access_s2member_level1)]
- GBP/USD oscillates in a narrow trading band near its highest level since May 11.
- Bets for an imminent Fed rate hike pause weigh on the USD and act as a tailwind.
- Expectations for more rate hikes by the BoE lend additional support to the major.
The pair currently trades last at 1.25578.
The previous day high was 1.2561 while the previous day low was 1.2433. The daily 38.2% Fib levels comes at 1.2512, expected to provide support. Similarly, the daily 61.8% fib level is at 1.2482, expected to provide support.
The GBP/USD pair is seen consolidating the overnight blowout rally to its highest level since May 11 and oscillating in a narrow trading band, just above mid-1.2500s during the Asian session on Friday.
The US Dollar (USD) languishes near a two-week low and continues to be weighed down by the disappointing release of the US Initial Jobless Claims, which in turn, acts as a tailwind for the GBP/USD pair. The US Department of Labor (DOL) reported on Thursday that the number of Americans filing new claims for unemployment benefits rose more than anticipated, to the highest level in more than 1-1/2 years last week. This, in turn, reinforced market expectations that the Federal Reserve (Fed) will pause rate hikes after a two-day policy meeting on June 13-14. This led to the overnight slide in the US Treasury bond yields and undermines the Greenback.
Adding to this, a slight improvement in the global risk sentiment further weighs on the safe-haven buck and offers additional support to the GBP/USD pair. That said, worries about a global economic slowdown might keep a lid on any optimism in the markets. In fact, the Organization for Economic Co-operation and Development (OECD) forecasts that the global economy is set for a weak recovery over the coming years as persistent core inflation and tighter monetary policy weigh on demand. OECD now expects the global economy to expand by 2.7% this year – the lowest annual rate of growth since the 2008-2009 financial crisis excluding the pandemic-hit year of 2020.
Furthermore, expectations that the Fed will hike rates again in July helps limit the downside for the Greenback and holds back traders from placing aggressive bullish bets around the GBP/USD pair. Despite last week’s dovish rhetoric by several Fed officials, surprise rate hikes by the Reserve Bank of Australia (RBA) and the Bank of Canada (BoC) this week suggest that the fight against inflation is still not over. This supports prospects for further tightening by the Fed. The downside for the major, however, remains cushioned on the back of expectations that the Bank of England (BoE) will be far more aggressive in policy tightening to contain stubbornly high inflation.
Traders, meanwhile, might prefer to move to the sidelines ahead of the latest US consumer inflation figures and the key central bank event risk – the highly anticipated FOMC monetary policy meeting – next week. In the meantime, the GBP/USD pair remains at the mercy of the USD price dynamics in the absence of any relevant market-moving economic releases – either from the UK or the US. Nevertheless, spot prices remain on track to register gains for the second successive week.
Technical Levels: Supports and Resistances
GBPUSD currently trading at 1.2558 at the time of writing. Pair opened at 1.256 and is trading with a change of -0.02 % .
| Overview | Overview.1 | |
|---|---|---|
| 0 | Today last price | 1.2558 |
| 1 | Today Daily Change | -0.0002 |
| 2 | Today Daily Change % | -0.0200 |
| 3 | Today daily open | 1.2560 |
The pair remains strongly bullish on the daily timeframe. It trades above its 20 SMA @ 1.2437, 50 SMA 1.2464, 100 SMA @ 1.2307 and 200 SMA @ 1.2011.
| Trends | Trends.1 | |
|---|---|---|
| 0 | Daily SMA20 | 1.2437 |
| 1 | Daily SMA50 | 1.2464 |
| 2 | Daily SMA100 | 1.2307 |
| 3 | Daily SMA200 | 1.2011 |
The previous day high was 1.2561 while the previous day low was 1.2433. The daily 38.2% Fib levels comes at 1.2512, expected to provide support. Similarly, the daily 61.8% fib level is at 1.2482, expected to provide support.
Note the levels of interest below:
- Pivot support is noted at 1.2475, 1.239, 1.2347
- Pivot resistance is noted at 1.2603, 1.2646, 1.2731
| Levels | Levels.1 |
|---|---|
| Previous Daily High | 1.2561 |
| Previous Daily Low | 1.2433 |
| Previous Weekly High | 1.2545 |
| Previous Weekly Low | 1.2327 |
| Previous Monthly High | 1.2680 |
| Previous Monthly Low | 1.2308 |
| Daily Fibonacci 38.2% | 1.2512 |
| Daily Fibonacci 61.8% | 1.2482 |
| Daily Pivot Point S1 | 1.2475 |
| Daily Pivot Point S2 | 1.2390 |
| Daily Pivot Point S3 | 1.2347 |
| Daily Pivot Point R1 | 1.2603 |
| Daily Pivot Point R2 | 1.2646 |
| Daily Pivot Point R3 | 1.2731 |
[/s2If]
Nehcap Expert Advisor
The NEHCAP MT4 EA is high quality professional trading system geared to generate returns without using GRID or martingales. Each trade has strict risk per trade parameter. The pairs under management include EURUSD, GBPUSD, AUDCAD, AUDNZD,GBPAUD, EURAUD, EURCAD, CHFJPY and many more.
The system is trading live: LIVE ACCOUNT TRACKING
You can run it free. Apply for a free trial and track our account. Buy the system or use profit share mechanism to generate returns on your MT4.
Join Our Telegram Group
")


