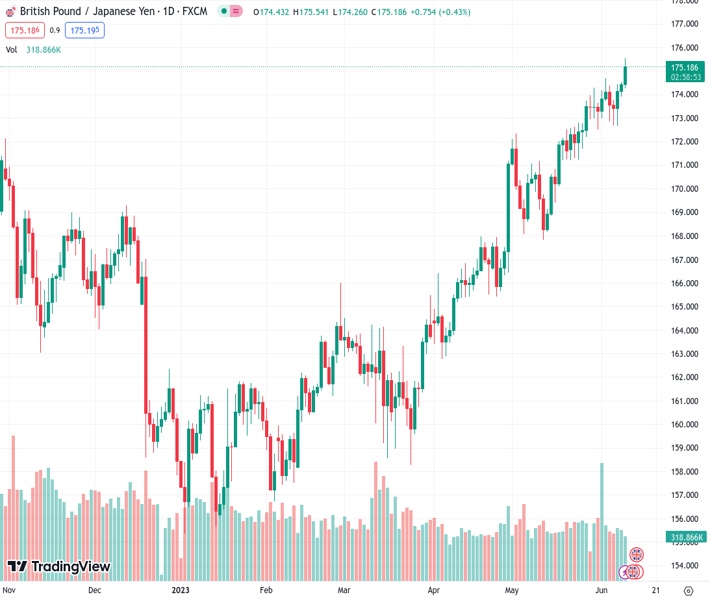
#GBPJPY @ 175.198 closes a four-consecutive week of gains soaring to its highest level since February 2016. (Pivot Orderbook analysis)
…
This is a premium post.
[s2If !current_user_can(access_s2member_level4)]Please register for FREE REGISTER to read full post below containing analysis. In case of any error or you think you are not able to read the full post below, please email us at support#nehcap.com [lwa][/s2If] [s2If current_user_can(access_s2member_level1)]
- GBP/JPY closes a four-consecutive week of gains soaring to its highest level since February 2016.
- BoJ is expected to stick with yield curve control.
- Yield divergence between gilts and Japanese bonds favours the GBP.
The pair currently trades last at 175.198.
The previous day high was 174.52 while the previous day low was 173.91. The daily 38.2% Fib levels comes at 174.29, expected to provide support. Similarly, the daily 61.8% fib level is at 174.14, expected to provide support.
GBP/JPY has soared to its highest level since February 2016, closing a four-consecutive week of gains. This surge comes in the wake of a dovish stance taken by the Bank of Japan (BOJ), which is expected to stick with its yield curve control policy to keep long-term interest rates low. The yield divergence between UK gilts and Japanese bonds has further favoured the British pound adding to the momentum of the GBP/JPY pair.
Bank of Japan (BoJ) officials, acknowledged that inflation has surpassed initial projections, which may result in upward revisions to the bank’s inflation forecasts in the upcoming macroeconomic assessments. Despite this, the BoJ maintains a cautious stance and does not express confidence in achieving the sustainable 2% inflation target. Consequently, policymakers emphasize the ongoing need for continued monetary stimulus to support and stabilize the prevailing economic conditions.
On the other hand, rising yields amid the expectations of a rate hike from 4.5% to 4.75% on June 22 by the Bank of England (BoE) seems to be responsible for the GBP/JPY upwards momentum. In that sense, the British yields increased across the board with the 2.5-year yields seeing more than 1% increases on the session.
Both the weekly and daily charts suggest that the bulls are clearly in charge of the short term. Specifically, on the daily chart, the Relative Strength Index (RSI) and Moving Average Convergence Divergence (MACD) are both showing strength standing in positive territory, and the pair trades above its main moving averages indicating that the buyers are in control.
In case the GBP/JPY continues to gain traction, the following resistance line up at the 175.50 zone followed then by the 176.00 zone and the 176.30 level. On the other hand, in case of a technical correction, support levels line up at the 174.40 zone and below the psychological mark at 174.00 and the 20-day Simple Moving Average (SMA) at 172.90.
Technical Levels: Supports and Resistances
GBPJPY currently trading at 175.24 at the time of writing. Pair opened at 174.49 and is trading with a change of 0.43 % .
| Overview | Overview.1 | |
|---|---|---|
| 0 | Today last price | 175.24 |
| 1 | Today Daily Change | 0.75 |
| 2 | Today Daily Change % | 0.43 |
| 3 | Today daily open | 174.49 |
The pair remains strongly bullish on the daily timeframe. It trades above its 20 SMA @ 172.65, 50 SMA 169.4, 100 SMA @ 165.41 and 200 SMA @ 164.72.
| Trends | Trends.1 | |
|---|---|---|
| 0 | Daily SMA20 | 172.65 |
| 1 | Daily SMA50 | 169.40 |
| 2 | Daily SMA100 | 165.41 |
| 3 | Daily SMA200 | 164.72 |
The previous day high was 174.52 while the previous day low was 173.91. The daily 38.2% Fib levels comes at 174.29, expected to provide support. Similarly, the daily 61.8% fib level is at 174.14, expected to provide support.
Note the levels of interest below:
- Pivot support is noted at 174.09, 173.7, 173.48
- Pivot resistance is noted at 174.71, 174.92, 175.32
| Levels | Levels.1 |
|---|---|
| Previous Daily High | 174.52 |
| Previous Daily Low | 173.91 |
| Previous Weekly High | 174.68 |
| Previous Weekly Low | 172.53 |
| Previous Monthly High | 174.28 |
| Previous Monthly Low | 167.84 |
| Daily Fibonacci 38.2% | 174.29 |
| Daily Fibonacci 61.8% | 174.14 |
| Daily Pivot Point S1 | 174.09 |
| Daily Pivot Point S2 | 173.70 |
| Daily Pivot Point S3 | 173.48 |
| Daily Pivot Point R1 | 174.71 |
| Daily Pivot Point R2 | 174.92 |
| Daily Pivot Point R3 | 175.32 |
[/s2If]
Nehcap Expert Advisor
The NEHCAP MT4 EA is high quality professional trading system geared to generate returns without using GRID or martingales. Each trade has strict risk per trade parameter. The pairs under management include EURUSD, GBPUSD, AUDCAD, AUDNZD,GBPAUD, EURAUD, EURCAD, CHFJPY and many more.
The system is trading live: LIVE ACCOUNT TRACKING
You can run it free. Apply for a free trial and track our account. Buy the system or use profit share mechanism to generate returns on your MT4.
Join Our Telegram Group
")


