#GBPJPY @ 175.077 takes the bids to refresh multi-month high during three-day winning streak., @nehcap view: Limited upside expected (Pivot Orderbook analysis)
…
This is a premium post.
[s2If !current_user_can(access_s2member_level4)]Please register for FREE REGISTER to read full post below containing analysis. In case of any error or you think you are not able to read the full post below, please email us at support#nehcap.com [lwa][/s2If] [s2If current_user_can(access_s2member_level1)]
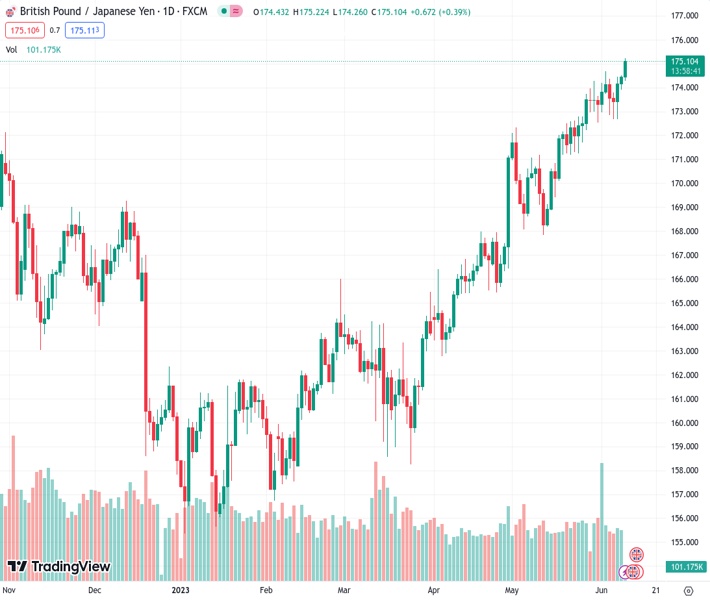
- GBP/JPY takes the bids to refresh multi-month high during three-day winning streak.
- Hesitance in confirming 14-week-old rising wedge, clear break of seven-month-long horizontal resistance-turned-support favor bulls.
- Overbought RSI can trigger pullback moves; wedge’s top line challenges buyers.
The pair currently trades last at 175.077.
The previous day high was 174.52 while the previous day low was 173.91. The daily 38.2% Fib levels comes at 174.29, expected to provide support. Similarly, the daily 61.8% fib level is at 174.14, expected to provide support.
GBP/JPY stays on the front foot for the third consecutive day around 175.20 as it rises to the fresh high since January 2016 heading into Friday’s London open. In doing so, the cross-currency pair justifies the early week’s rebound from a lower line of the rising wedge bearish chart pattern established in late February.
Apart from the previous rebound within a bearish chart formation, the quote’s successful trading beyond the seven-week-old horizontal resistance, now support around 172.00, also favors the GBP/JPY bulls as the key to refreshing the multi-year high.
It should be noted, however, that the overbought RSI (14) line, challenges the GBP/JPY bulls.
Apart from the overbought RSI, the top line of the aforementioned multi-day-old rising wedge, near 176.20, can also challenge the cross-currency pair.
Hence, the GBP/JPY pair traders are likely to remain bullish unless witnessing a sure confirmation of the bearish chart formation, by downside concurrence of the said wedge’s lower line, close to 173.80 at the latest.
Even so, the 21-DMA level of around 172.75 can act as an extra filter towards the south for the pair sellers ahead of the previous resistance line area surrounding 172.00.
Fundamentally, the British Chambers of Commerce (BCC) said that the UK economy will probably skirt a recession but sputter through “anemic” growth in the year ahead due to lingering inflation, per Bloomberg. On the other hand, the US Treasury bond yields as the benchmark 10-year and two-year Treasury bond yields remain sidelined near 3.73% and 4.52% respectively, after reversing from the highest levels in a fortnight and snapping a two-day winning streak in that order the previous day.
Also read: GBP/JPY jumps to the highest level since 2016, around 174.80 region
Trend: Limited upside expected
Technical Levels: Supports and Resistances
GBPJPY currently trading at 175.2 at the time of writing. Pair opened at 174.49 and is trading with a change of 0.41% % .
| Overview | Overview.1 | |
|---|---|---|
| 0 | Today last price | 175.2 |
| 1 | Today Daily Change | 0.71 |
| 2 | Today Daily Change % | 0.41% |
| 3 | Today daily open | 174.49 |
The pair remains strongly bullish on the daily timeframe. It trades above its 20 SMA @ 172.65, 50 SMA 169.4, 100 SMA @ 165.41 and 200 SMA @ 164.72.
| Trends | Trends.1 | |
|---|---|---|
| 0 | Daily SMA20 | 172.65 |
| 1 | Daily SMA50 | 169.40 |
| 2 | Daily SMA100 | 165.41 |
| 3 | Daily SMA200 | 164.72 |
The previous day high was 174.52 while the previous day low was 173.91. The daily 38.2% Fib levels comes at 174.29, expected to provide support. Similarly, the daily 61.8% fib level is at 174.14, expected to provide support.
Note the levels of interest below:
- Pivot support is noted at 174.09, 173.7, 173.48
- Pivot resistance is noted at 174.71, 174.92, 175.32
| Levels | Levels.1 |
|---|---|
| Previous Daily High | 174.52 |
| Previous Daily Low | 173.91 |
| Previous Weekly High | 174.68 |
| Previous Weekly Low | 172.53 |
| Previous Monthly High | 174.28 |
| Previous Monthly Low | 167.84 |
| Daily Fibonacci 38.2% | 174.29 |
| Daily Fibonacci 61.8% | 174.14 |
| Daily Pivot Point S1 | 174.09 |
| Daily Pivot Point S2 | 173.70 |
| Daily Pivot Point S3 | 173.48 |
| Daily Pivot Point R1 | 174.71 |
| Daily Pivot Point R2 | 174.92 |
| Daily Pivot Point R3 | 175.32 |
[/s2If]
Nehcap Expert Advisor
The NEHCAP MT4 EA is high quality professional trading system geared to generate returns without using GRID or martingales. Each trade has strict risk per trade parameter. The pairs under management include EURUSD, GBPUSD, AUDCAD, AUDNZD,GBPAUD, EURAUD, EURCAD, CHFJPY and many more.
The system is trading live: LIVE ACCOUNT TRACKING
You can run it free. Apply for a free trial and track our account. Buy the system or use profit share mechanism to generate returns on your MT4.
Join Our Telegram Group
")


