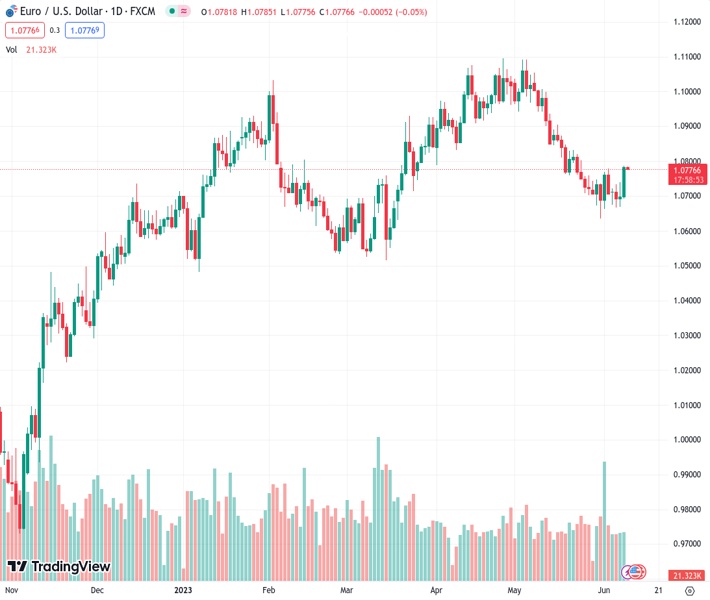
#EURUSD @ 1.07769 consolidates Thursday’s strong move up to over a two-week high. (Pivot Orderbook analysis)
…
This is a premium post.
[s2If !current_user_can(access_s2member_level4)]Please register for FREE REGISTER to read full post below containing analysis. In case of any error or you think you are not able to read the full post below, please email us at support#nehcap.com [lwa][/s2If] [s2If current_user_can(access_s2member_level1)]
- EUR/USD consolidates Thursday’s strong move up to over a two-week high.
- Acceptance above the 1.0745-50 confluence hurdle favours bullish traders.
- A convincing beak below the 1.0700 mark will negate the positive outlook.
The pair currently trades last at 1.07769.
The previous day high was 1.0787 while the previous day low was 1.0696. The daily 38.2% Fib levels comes at 1.0752, expected to provide support. Similarly, the daily 61.8% fib level is at 1.0731, expected to provide support.
The EUR/USD pair is seen consolidating the previous day’s strong gains to over a two-week high and oscillating in a narrow trading band through the Asian session on Friday. Spot prices currently trade around the 1.0775-1.0780 region and seem poised to build on the recent bounce from the 1.0635 region, or the lowest level since March 20 touched last week.
The overnight sharp rise confirms a breakout through the 1.0745 confluence – comprising the 100-period Simple Moving Average (SMA), the 23.6% Fibonacci retracement level of the downfall witnessed in May and a short-term descending trend-line. This, in turn, favours bullish traders and supports prospects for a further near-term appreciating move. That said, technical indicators on the daily chart – though have recovered from the negative territory – are yet to confirm a bullish outlook. Hence, any subsequent move up is more likely to confront some resistance near the 1.0800 round-figure mark, representing the 38.2% Fibo. level.
Some follow-through buying, however, will set the stage for additional gains and lift the EUR/USD pair to the next relevant hurdle near the 1.0860 region. The latter represents the 200-period SMA on the 4-hour chart and the 50% Fibo. level, which if cleared decisively will suggest that the recent pullback from over a one-year high touched in May has run its course. Spot prices might then aim to surpass the 1.0900 round figure and test the 61.8% Fibo. level, around the 1.0915-1.0920 zone.
On the flip side, the 1.0750-1.0745 confluence resistance breakpoint now seems to protect the immediate downside ahead of the 1.0700 mark. This is closely followed by an upward sloping trend-line, currently pegged near the 1.0680 region, below which the EUR/USD pair could slide back towards the May monthly swing low, around the 1.0635 area. Some follow-through selling will be seen as a fresh trigger for bearish traders and drag spot prices below the 1.0600 mark, towards testing the 1.0540-1.0535 intermediate support en route to the 1.0500 psychological mark.
Technical Levels: Supports and Resistances
EURUSD currently trading at 1.0778 at the time of writing. Pair opened at 1.0782 and is trading with a change of -0.04 % .
| Overview | Overview.1 | |
|---|---|---|
| 0 | Today last price | 1.0778 |
| 1 | Today Daily Change | -0.0004 |
| 2 | Today Daily Change % | -0.0400 |
| 3 | Today daily open | 1.0782 |
The pair is trading above its 20 Daily moving average @ 1.0764, below its 50 Daily moving average @ 1.0887 , below its 100 Daily moving average @ 1.0809 and above its 200 Daily moving average @ 1.0516
| Trends | Trends.1 | |
|---|---|---|
| 0 | Daily SMA20 | 1.0764 |
| 1 | Daily SMA50 | 1.0887 |
| 2 | Daily SMA100 | 1.0809 |
| 3 | Daily SMA200 | 1.0516 |
The previous day high was 1.0787 while the previous day low was 1.0696. The daily 38.2% Fib levels comes at 1.0752, expected to provide support. Similarly, the daily 61.8% fib level is at 1.0731, expected to provide support.
Note the levels of interest below:
- Pivot support is noted at 1.0723, 1.0664, 1.0632
- Pivot resistance is noted at 1.0814, 1.0846, 1.0906
| Levels | Levels.1 |
|---|---|
| Previous Daily High | 1.0787 |
| Previous Daily Low | 1.0696 |
| Previous Weekly High | 1.0779 |
| Previous Weekly Low | 1.0635 |
| Previous Monthly High | 1.1092 |
| Previous Monthly Low | 1.0635 |
| Daily Fibonacci 38.2% | 1.0752 |
| Daily Fibonacci 61.8% | 1.0731 |
| Daily Pivot Point S1 | 1.0723 |
| Daily Pivot Point S2 | 1.0664 |
| Daily Pivot Point S3 | 1.0632 |
| Daily Pivot Point R1 | 1.0814 |
| Daily Pivot Point R2 | 1.0846 |
| Daily Pivot Point R3 | 1.0906 |
[/s2If]
Nehcap Expert Advisor
The NEHCAP MT4 EA is high quality professional trading system geared to generate returns without using GRID or martingales. Each trade has strict risk per trade parameter. The pairs under management include EURUSD, GBPUSD, AUDCAD, AUDNZD,GBPAUD, EURAUD, EURCAD, CHFJPY and many more.
The system is trading live: LIVE ACCOUNT TRACKING
You can run it free. Apply for a free trial and track our account. Buy the system or use profit share mechanism to generate returns on your MT4.
Join Our Telegram Group
")


