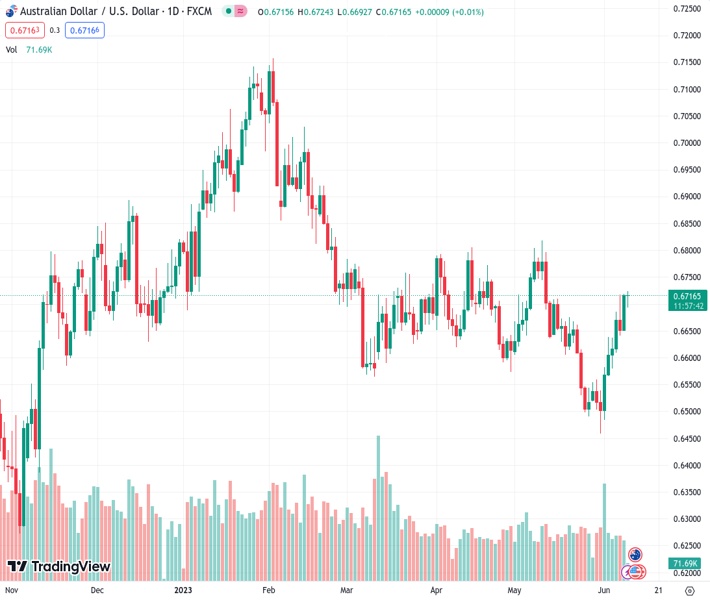
#AUDUSD @ 0.67160 touches a fresh multi-week high on Friday, albeit lacks any follow-through. (Pivot Orderbook analysis)
…
This is a premium post.
[s2If !current_user_can(access_s2member_level4)]Please register for FREE REGISTER to read full post below containing analysis. In case of any error or you think you are not able to read the full post below, please email us at support#nehcap.com [lwa][/s2If] [s2If current_user_can(access_s2member_level1)]
- AUD/USD touches a fresh multi-week high on Friday, albeit lacks any follow-through.
- The RBA’s hawkish outlook underpins the Aussie despite dismal Chinese inflation data.
- Rebounding US bond yields revives the USD demand and acts as a headwind for the pair.
The pair currently trades last at 0.67160.
The previous day high was 0.6718 while the previous day low was 0.6652. The daily 38.2% Fib levels comes at 0.6693, expected to provide support. Similarly, the daily 61.8% fib level is at 0.6677, expected to provide support.
The AUD/USD pair reverses an intraday dip to sub-0.6700 levels and climbs to over a four-week high during the early part of the European session on Friday. Spot prices, however, struggle to capitalize on the move and currently trade around the 0.6710-0.6715 region, nearly unchanged for the day.
The Australian Dollar (AUD) continues to draw support from the Reserve Bank of Australia’s (RBA) surprise 25 bps rate hike earlier this week and a more hawkish policy statement. In fact, RBA Governor Lowe on Wednesday defended the move to lift the benchmark rates above 4% for the first time in nearly 12 years and reiterated that interest rates may need to rise further in order to curb overheated inflation. This, in turn, acts as a tailwind for the AUD/USD pair, though a combination of factors is holding back bulls from placing aggressive bets and capping the upside, at least for the time being.
A modest uptick in the US Treasury bond yields assists the US Dollar (USD) to regain positive traction following the overnight slump that followed the dismal US macro data, showing that Initial Jobless Claims surged to a 20-month high last week. Apart from this, a generally weaker risk tone provides an additional boost to the safe-haven Greenback and contributes to keeping a lid on any further gains for the AUD/USD pair. The market sentiment remains fragile in the wake of growing worries about a global economic downturn, further fueled by the incoming disappointing Chinese economic data.
In fact, the National Bureau of Statistics reported that China’s headline CPI shrank by 0.2% in May, while Producer Price Index (PPI) registered its worst decline since February 2016 and fell 4.6% YoY. This further points to slowing post-COVID recovery in the world’s second-largest economy, which tempers investors’ appetite for riskier assets and holds back traders from placing aggressive bullish bets around the China-proxy Aussie. Even from a technical perspective, the recent repeated failures near the 100-day Simple Moving Average (SMA) warrant caution before positioning for any further gains.
There isn’t any relevant market-moving economic data due for release from the US on Friday, leaving the USD bulls at the mercy of the US bond yields. Apart from this, the broader risk sentiment will drive the safe-haven demand and provide some impetus to the risk-sensitive Aussie. Nevertheless, the AUD/USD pair remains on track to register strong gains for the second successive week as the focus now shifts to the highly-anticipated FOMC policy meeting on June 13-14.
Technical Levels: Supports and Resistances
AUDUSD currently trading at 0.6715 at the time of writing. Pair opened at 0.6716 and is trading with a change of -0.01 % .
| Overview | Overview.1 | |
|---|---|---|
| 0 | Today last price | 0.6715 |
| 1 | Today Daily Change | -0.0001 |
| 2 | Today Daily Change % | -0.0100 |
| 3 | Today daily open | 0.6716 |
The pair is trading above its 20 Daily moving average @ 0.6608, above its 50 Daily moving average @ 0.6662 , below its 100 Daily moving average @ 0.6743 and above its 200 Daily moving average @ 0.6691
| Trends | Trends.1 | |
|---|---|---|
| 0 | Daily SMA20 | 0.6608 |
| 1 | Daily SMA50 | 0.6662 |
| 2 | Daily SMA100 | 0.6743 |
| 3 | Daily SMA200 | 0.6691 |
The previous day high was 0.6718 while the previous day low was 0.6652. The daily 38.2% Fib levels comes at 0.6693, expected to provide support. Similarly, the daily 61.8% fib level is at 0.6677, expected to provide support.
Note the levels of interest below:
- Pivot support is noted at 0.6673, 0.6629, 0.6606
- Pivot resistance is noted at 0.6739, 0.6762, 0.6805
| Levels | Levels.1 |
|---|---|
| Previous Daily High | 0.6718 |
| Previous Daily Low | 0.6652 |
| Previous Weekly High | 0.6639 |
| Previous Weekly Low | 0.6458 |
| Previous Monthly High | 0.6818 |
| Previous Monthly Low | 0.6458 |
| Daily Fibonacci 38.2% | 0.6693 |
| Daily Fibonacci 61.8% | 0.6677 |
| Daily Pivot Point S1 | 0.6673 |
| Daily Pivot Point S2 | 0.6629 |
| Daily Pivot Point S3 | 0.6606 |
| Daily Pivot Point R1 | 0.6739 |
| Daily Pivot Point R2 | 0.6762 |
| Daily Pivot Point R3 | 0.6805 |
[/s2If]
Nehcap Expert Advisor
The NEHCAP MT4 EA is high quality professional trading system geared to generate returns without using GRID or martingales. Each trade has strict risk per trade parameter. The pairs under management include EURUSD, GBPUSD, AUDCAD, AUDNZD,GBPAUD, EURAUD, EURCAD, CHFJPY and many more.
The system is trading live: LIVE ACCOUNT TRACKING
You can run it free. Apply for a free trial and track our account. Buy the system or use profit share mechanism to generate returns on your MT4.
Join Our Telegram Group
")


