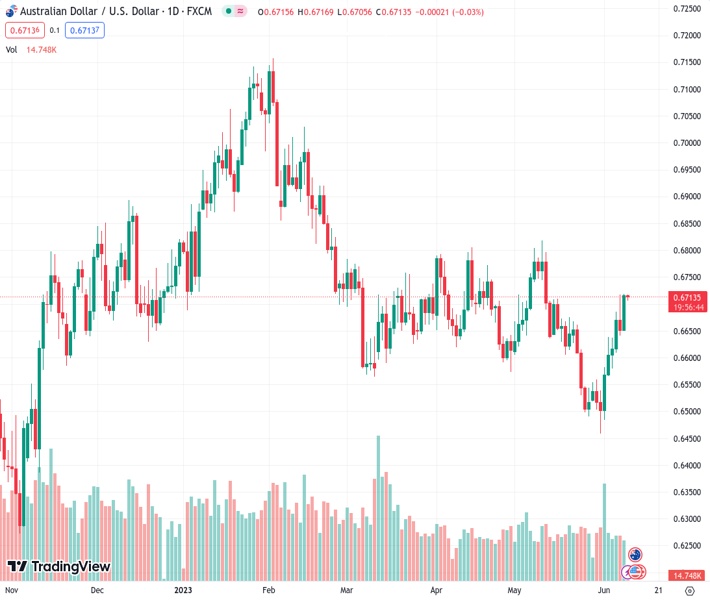
#AUDUSD @ 0.67137 portrays pre-data positioning at one-month high, pares the biggest daily loss in a week., @nehcap view: Limited upside expected (Pivot Orderbook analysis)
…
This is a premium post.
[s2If !current_user_can(access_s2member_level4)]Please register for FREE REGISTER to read full post below containing analysis. In case of any error or you think you are not able to read the full post below, please email us at support#nehcap.com [lwa][/s2If] [s2If current_user_can(access_s2member_level1)]
- AUD/USD portrays pre-data positioning at one-month high, pares the biggest daily loss in a week.
- Struggles to justify upbeat break of four-month-old resistance line, bullish MACD as RSI conditions prod Aussie bulls.
- Convergence of 100-DMA, descending trend line from early February appears a tough nut to crack for AUD/USD buyers.
- Aussie pair’s further upside also needs validation from China inflation, May’s high.
The pair currently trades last at 0.67137.
The previous day high was 0.6718 while the previous day low was 0.6652. The daily 38.2% Fib levels comes at 0.6693, expected to provide support. Similarly, the daily 61.8% fib level is at 0.6677, expected to provide support.
AUD/USD retreats from the highest level in a month, marked the previous day, to 0.6710 during Friday’s mid-Asian session. In doing so, the Aussie pair consolidates the biggest daily jump in a week as traders prepare for the top-tier inflation gauges from Australia’s biggest customer China.
Also read:
It should be noted that the Aussie pair’s rally on Thursday allowed it to cross the previous key resistance line stretched from May 02 amid bullish MACD signals. However, the nearly overbought RSI conditions prod the Aussie pair buyers amid the pre-data consolidation of late.
Hence, the AUD/USD bulls are in the driver’s seat but need validation from China Consumer Price Index (CPI) and Producer Price Index (PPI) to keep the reins. Even so, a convergence of the descending trend line from February 14 and the 100-DMA, near 0.6740, appears a tough nut to crack for the pair buyers for conviction.
Furthermore, May’s high of 0.6820 can act as the last defense of the AUD/USD bears.
On the contrary, a daily closing below the resistance-turned-support line from early February, around 0.6700 by the press time, could quickly drag the AUD/USD pair towards the 21-DMA support of around 0.6610.
In a case where the AUD/USD drops below 0.6610, the odds of witnessing a slump to 0.6560 and then to the previous monthly low of near 0.6460 can’t be ruled out.
Trend: Limited upside expected
Technical Levels: Supports and Resistances
AUDUSD currently trading at 0.6711 at the time of writing. Pair opened at 0.6716 and is trading with a change of -0.07% % .
| Overview | Overview.1 | |
|---|---|---|
| 0 | Today last price | 0.6711 |
| 1 | Today Daily Change | -0.0005 |
| 2 | Today Daily Change % | -0.07% |
| 3 | Today daily open | 0.6716 |
The pair is trading above its 20 Daily moving average @ 0.6608, above its 50 Daily moving average @ 0.6662 , below its 100 Daily moving average @ 0.6743 and above its 200 Daily moving average @ 0.6691
| Trends | Trends.1 | |
|---|---|---|
| 0 | Daily SMA20 | 0.6608 |
| 1 | Daily SMA50 | 0.6662 |
| 2 | Daily SMA100 | 0.6743 |
| 3 | Daily SMA200 | 0.6691 |
The previous day high was 0.6718 while the previous day low was 0.6652. The daily 38.2% Fib levels comes at 0.6693, expected to provide support. Similarly, the daily 61.8% fib level is at 0.6677, expected to provide support.
Note the levels of interest below:
- Pivot support is noted at 0.6673, 0.6629, 0.6606
- Pivot resistance is noted at 0.6739, 0.6762, 0.6805
| Levels | Levels.1 |
|---|---|
| Previous Daily High | 0.6718 |
| Previous Daily Low | 0.6652 |
| Previous Weekly High | 0.6639 |
| Previous Weekly Low | 0.6458 |
| Previous Monthly High | 0.6818 |
| Previous Monthly Low | 0.6458 |
| Daily Fibonacci 38.2% | 0.6693 |
| Daily Fibonacci 61.8% | 0.6677 |
| Daily Pivot Point S1 | 0.6673 |
| Daily Pivot Point S2 | 0.6629 |
| Daily Pivot Point S3 | 0.6606 |
| Daily Pivot Point R1 | 0.6739 |
| Daily Pivot Point R2 | 0.6762 |
| Daily Pivot Point R3 | 0.6805 |
[/s2If]
Nehcap Expert Advisor
The NEHCAP MT4 EA is high quality professional trading system geared to generate returns without using GRID or martingales. Each trade has strict risk per trade parameter. The pairs under management include EURUSD, GBPUSD, AUDCAD, AUDNZD,GBPAUD, EURAUD, EURCAD, CHFJPY and many more.
The system is trading live: LIVE ACCOUNT TRACKING
You can run it free. Apply for a free trial and track our account. Buy the system or use profit share mechanism to generate returns on your MT4.
Join Our Telegram Group
")


