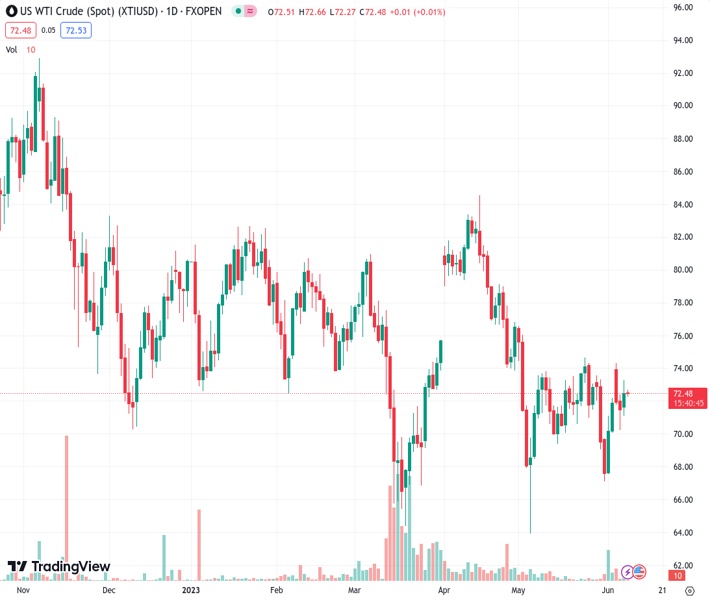
WTI has turned sideways above $72.00 as investors are assessing multiple economic catalysts. (Pivot Orderbook analysis)
…
This is a premium post.
[s2If !current_user_can(access_s2member_level4)]Please register for FREE REGISTER to read full post below containing analysis. In case of any error or you think you are not able to read the full post below, please email us at support#nehcap.com [lwa][/s2If] [s2If current_user_can(access_s2member_level1)]
- WTI has turned sideways above $72.00 as investors are assessing multiple economic catalysts.
- Inventories of Gasoline and Distillate in the US rose significantly higher, portraying a sharp decline in fuel demand.
- Chances of a steady interest rate decision by the Fed have dropped to 67%, which is sufficient to sour sentiment.
The pair currently trades last at 72.44.
The previous day high was 73.27 while the previous day low was 71.11. The daily 38.2% Fib levels comes at 72.44, expected to provide resistance. Similarly, the daily 61.8% fib level is at 71.93, expected to provide support.
West Texas Intermediate (WTI), futures on NYMEX, are oscillating in a limited range above $72.00 in the late Asian session. The oil price is taking sufficient time required to digest demand catalysts belonging to the United States and China. Apart from that, investors are preparing for the Federal Reserve’s (Fed) interest rate policy for June.
Reading from US Energy Information Administration (EIA) about oil inventory data for the week ending June 02 showed a drawdown by 0.451M while the street was anticipating a build-up. Contrary to that, inventories of Gasoline and Distillate rose significantly higher than estimates, portraying a sharp decline in fuel demand.
Meanwhile, US factory activity has also remained weak in May as the US ISM agency reported a seventh straight contraction in the manufacturing sector, which brings in transparency that the oil demand in the US is extremely bleak.
Going forward, the focus will be on the Fed’s June policy. As per the CME Fedwatch tool, the chances of a steady interest rate decision have dropped to 67%, which is sufficient to trigger a risk-aversion theme.
On the China front, Trade Balance data dropped sharply to $65.81B vs. the estimates of $92B and the former release of $90.21B. Exports were sharply contracted by 7.5%, which indicates that consumers are shifting to other countries for outsourcing or the global demand is turning extremely weak. In all sense, demand for the oil price is getting vulnerable. It is highly likely that the impact of OPEC’s production cuts would wane as demand remains the major catalyst for analyzing the oil price.
Investors should note that China is the world’s biggest importer of oil and poor activity in China impact heavily on the oil price.
Technical Levels: Supports and Resistances
XTIUSD currently trading at 72.44 at the time of writing. Pair opened at 72.52 and is trading with a change of -0.11 % .
| Overview | Overview.1 | |
|---|---|---|
| 0 | Today last price | 72.44 |
| 1 | Today Daily Change | -0.08 |
| 2 | Today Daily Change % | -0.11 |
| 3 | Today daily open | 72.52 |
The pair is trading above its 20 Daily moving average @ 71.65, below its 50 Daily moving average @ 74.78 , below its 100 Daily moving average @ 75.47 and below its 200 Daily moving average @ 78.75
| Trends | Trends.1 | |
|---|---|---|
| 0 | Daily SMA20 | 71.65 |
| 1 | Daily SMA50 | 74.78 |
| 2 | Daily SMA100 | 75.47 |
| 3 | Daily SMA200 | 78.75 |
The previous day high was 73.27 while the previous day low was 71.11. The daily 38.2% Fib levels comes at 72.44, expected to provide resistance. Similarly, the daily 61.8% fib level is at 71.93, expected to provide support.
Note the levels of interest below:
- Pivot support is noted at 71.33, 70.14, 69.18
- Pivot resistance is noted at 73.49, 74.46, 75.65
| Levels | Levels.1 |
|---|---|
| Previous Daily High | 73.27 |
| Previous Daily Low | 71.11 |
| Previous Weekly High | 73.58 |
| Previous Weekly Low | 67.12 |
| Previous Monthly High | 76.61 |
| Previous Monthly Low | 64.31 |
| Daily Fibonacci 38.2% | 72.44 |
| Daily Fibonacci 61.8% | 71.93 |
| Daily Pivot Point S1 | 71.33 |
| Daily Pivot Point S2 | 70.14 |
| Daily Pivot Point S3 | 69.18 |
| Daily Pivot Point R1 | 73.49 |
| Daily Pivot Point R2 | 74.46 |
| Daily Pivot Point R3 | 75.65 |
[/s2If]
Nehcap Expert Advisor
The NEHCAP MT4 EA is high quality professional trading system geared to generate returns without using GRID or martingales. Each trade has strict risk per trade parameter. The pairs under management include EURUSD, GBPUSD, AUDCAD, AUDNZD,GBPAUD, EURAUD, EURCAD, CHFJPY and many more.
The system is trading live: LIVE ACCOUNT TRACKING
You can run it free. Apply for a free trial and track our account. Buy the system or use profit share mechanism to generate returns on your MT4.
Join Our Telegram Group
")


