#USDMXN @ 17.3650 gains ground as US Jobless Claims soar, Mexican inflation dips. (Pivot Orderbook analysis)
…
This is a premium post.
[s2If !current_user_can(access_s2member_level4)]Please register for FREE REGISTER to read full post below containing analysis. In case of any error or you think you are not able to read the full post below, please email us at support#nehcap.com [lwa][/s2If] [s2If current_user_can(access_s2member_level1)]
- USD/MXN gains ground as US Jobless Claims soar, Mexican inflation dips.
- Speculation of Banxico pausing tightening cycle boosts USD/MXN advance.
- Market eyeing US inflation data release, FOMC meeting amid global rate decision woes.
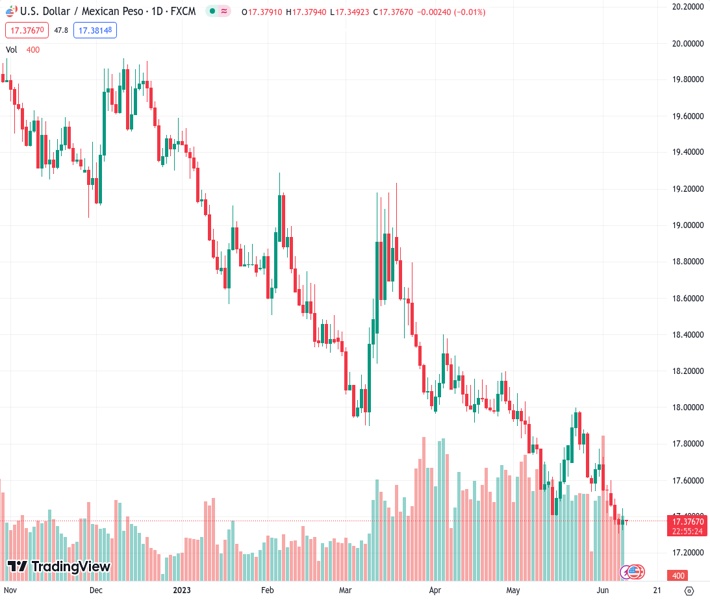
The pair currently trades last at 17.3650.
The previous day high was 17.3967 while the previous day low was 17.3055. The daily 38.2% Fib levels comes at 17.3403, expected to provide support. Similarly, the daily 61.8% fib level is at 17.3619, expected to provide support.
After falling to seven-year lows on Wednesday, the USD/MXN staged a comeback on Thursday, though it could be short-lived as the Asian session begins. The USD/MXN is trading at 17.3633, down 0.09%, after finishing Thursday’s session positive, with modest gains of 0.12%.
Wall Street closed the session with solid gains. The USD/MXN advanced on data from both countries, which underpinned the pair, as inflation in Mexico dipped below estimates. According to the Instituto Nacional de Estadistica, Geografia e Informatica (INEGI), the Consumer Price Index (CPI) in May fell -0.22% MoM, well below estimates of -0.16%. Annually based, CPI fell below the prior’s month 6.29%, at 5.84%, beneath the consensus of 5.9%.
Across the border, the US Bureau of Labor Statistics (BLS) featured Initial Jobless Claims for the last week ending June 3 jumped 261K, up from 232K expected by analysts, the highest since October 2021. That adds to an outstanding Nonfarm Payrolls report last Friday, which showed the economy created 339K jobs, but the rise in the Unemployment Rate was a prelude to the previous week’s data.
Following both releases, the USD/MXN advanced from around the 17.3500 figure towards the daily high at 17.4426 on speculations of a pause of the Bank of Mexico (Banxico) tightening cycle. Regarding the US Federal Reserve (Fed), comments in the last week cemented the case for skipping raising rates in June and waiting for July.
However, the latest monetary policy decisions by the Reserve Bank of Australia (RBA) and the Bank of Canada (BoC) sparked concerns about what the Fed will do. Given that the RBA and the BoC kept rates on hold, inflation has resumed its upward path in some meetings. That triggered a reaction by both institutions.
Upcoming events
The US calendar is empty, with traders eyeing Tuesday, June 13, with the release of inflation data, alongside the beginning of the FOMC’s meeting.
The daily chart portrays the USD/MXN pair as downward biased, though it appears to be bottoming. Although that has been commented on in previous articles, it should be taken cautiously. A double bottom could be forming, but it would need to claim two daily EMAs, the 20 and 50-day period, each at 17.5851 and 17.8217, before challenging resistance at a May 23 high of 17.99. Once cleared, the following supply area to test would be the 100-day EMA at 18.1741. Conversely, the pair could continue printing new multi-year lows below the current YTD low at 17.30.
Technical Levels: Supports and Resistances
USDMXN currently trading at 17.3763 at the time of writing. Pair opened at 17.362 and is trading with a change of 0.08 % .
| Overview | Overview.1 | |
|---|---|---|
| 0 | Today last price | 17.3763 |
| 1 | Today Daily Change | 0.0143 |
| 2 | Today Daily Change % | 0.0800 |
| 3 | Today daily open | 17.3620 |
The pair remains strongly bearish on the daily time frame. It trades below the 20 SMA @ 17.6318, 50 SMA 17.8616, 100 SMA @ 18.2137 and 200 SMA @ 18.945.
| Trends | Trends.1 | |
|---|---|---|
| 0 | Daily SMA20 | 17.6318 |
| 1 | Daily SMA50 | 17.8616 |
| 2 | Daily SMA100 | 18.2137 |
| 3 | Daily SMA200 | 18.9450 |
The previous day high was 17.3967 while the previous day low was 17.3055. The daily 38.2% Fib levels comes at 17.3403, expected to provide support. Similarly, the daily 61.8% fib level is at 17.3619, expected to provide support.
Note the levels of interest below:
- Pivot support is noted at 17.3127, 17.2635, 17.2215
- Pivot resistance is noted at 17.4039, 17.4459, 17.4951
| Levels | Levels.1 |
|---|---|
| Previous Daily High | 17.3967 |
| Previous Daily Low | 17.3055 |
| Previous Weekly High | 17.7716 |
| Previous Weekly Low | 17.4195 |
| Previous Monthly High | 18.0780 |
| Previous Monthly Low | 17.4203 |
| Daily Fibonacci 38.2% | 17.3403 |
| Daily Fibonacci 61.8% | 17.3619 |
| Daily Pivot Point S1 | 17.3127 |
| Daily Pivot Point S2 | 17.2635 |
| Daily Pivot Point S3 | 17.2215 |
| Daily Pivot Point R1 | 17.4039 |
| Daily Pivot Point R2 | 17.4459 |
| Daily Pivot Point R3 | 17.4951 |
[/s2If]
Nehcap Expert Advisor
The NEHCAP MT4 EA is high quality professional trading system geared to generate returns without using GRID or martingales. Each trade has strict risk per trade parameter. The pairs under management include EURUSD, GBPUSD, AUDCAD, AUDNZD,GBPAUD, EURAUD, EURCAD, CHFJPY and many more.
The system is trading live: LIVE ACCOUNT TRACKING
You can run it free. Apply for a free trial and track our account. Buy the system or use profit share mechanism to generate returns on your MT4.
Join Our Telegram Group
")


