#USDJPY @ 139.922 pares intraday losses, the first in three, amid mixed catalysts. (Pivot Orderbook analysis)
…
This is a premium post.
[s2If !current_user_can(access_s2member_level4)]Please register for FREE REGISTER to read full post below containing analysis. In case of any error or you think you are not able to read the full post below, please email us at support#nehcap.com [lwa][/s2If] [s2If current_user_can(access_s2member_level1)]
- USD/JPY pares intraday losses, the first in three, amid mixed catalysts.
- Japan’s Annualized GDP revised higher for Q1 but other growth signals remain sluggish.
- Yields grind higher amid concerns about economic slowdown, higher rates from key central banks.
- Second-tier US, Japan data and risk catalysts eyed for clear directions.
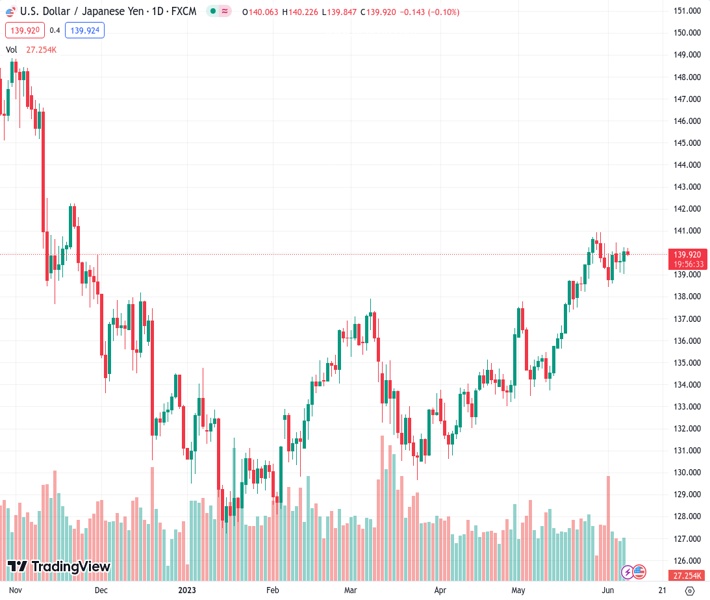
The pair currently trades last at 139.922.
The previous day high was 140.25 while the previous day low was 139.02. The daily 38.2% Fib levels comes at 139.78, expected to provide support. Similarly, the daily 61.8% fib level is at 139.49, expected to provide support.
USD/JPY licks its wounds around the 140.00 psychological magnet during the first loss-making day in three as Tokyo opens for trading on Thursday. In doing so, the Yen pair struggles to justify upbeat Treasury bond yields amid mixed data at home.
That said, Japan’s Gross Domestic Product (GDP) slipped to -0.3% in the first quarter (Q1) of 2023, versus 0.5% expected and 0.4% prior. However, the GDP Annualized got a strong upward revision to 2.7% versus 1.9% market estimation and 1.6% prior readings. It should be noted that the Current Account balance also came in better-than-forecast with
¥1,895.1B figures for April and the Bank Landing rose in May whereas the Trade Balance – BOP Basis improves to ¥-113.1B in April.
“Japan’s economy grew more than initially thought in January-March, revised data showed on Thursday, as a post-pandemic pickup in corporate and consumer spending helped offset the hit to exports from slowing global demand,” said Reuters after data.
Elsewhere, the benchmark US 10-year Treasury bond yields rose the most in five weeks to 3.79% while the two-year counterpart marched to 4.52% at the latest. That said, the US 10-year bond coupons remain mostly unchanged at 3.79% by the press time whereas the two-year yields grind higher to 4.54% as we write.
It should be noted that recent challenges to the major economies, as perceived from the latest downbeat statistics from the top-tier economies, renew recession fears and weigh on the USD/JPY price. Adding strength to the economic pessimism are the concerns surrounding higher interest rates from the headline central banks, especially after the latest hawkish surprises from the Reserve Bank of Australia and the Bank of Canada (BoC).
On Wednesday, Bank of Japan (BoJ) Governor Kazuo Ueda said, “When achievement of price target is foreseen, we will discuss specifics of an exit policy and disclose information as needed.”
Against this backdrop, Wall Street closed mixed and S&500 Futures struggle for clear directions.
Looking ahead, second-tier statistics from the US and Japan may entertain the USD/JPY traders. However, risk catalysts and fears of higher rates, as well as economic slowdown concerns, can lure the Yen pair sellers.
A one-week-old bullish pennant, currently between 140.20 and 139.20, restricts immediate USD/JPY moves amid upbeat oscillators.
Technical Levels: Supports and Resistances
USDJPY currently trading at 139.97 at the time of writing. Pair opened at 140.1 and is trading with a change of -0.09% % .
| Overview | Overview.1 | |
|---|---|---|
| 0 | Today last price | 139.97 |
| 1 | Today Daily Change | -0.13 |
| 2 | Today Daily Change % | -0.09% |
| 3 | Today daily open | 140.1 |
The pair remains strongly bullish on the daily timeframe. It trades above its 20 SMA @ 138.6, 50 SMA 135.8, 100 SMA @ 134.3 and 200 SMA @ 137.31.
| Trends | Trends.1 | |
|---|---|---|
| 0 | Daily SMA20 | 138.60 |
| 1 | Daily SMA50 | 135.80 |
| 2 | Daily SMA100 | 134.30 |
| 3 | Daily SMA200 | 137.31 |
The previous day high was 140.25 while the previous day low was 139.02. The daily 38.2% Fib levels comes at 139.78, expected to provide support. Similarly, the daily 61.8% fib level is at 139.49, expected to provide support.
Note the levels of interest below:
- Pivot support is noted at 139.34, 138.57, 138.12
- Pivot resistance is noted at 140.56, 141.01, 141.78
| Levels | Levels.1 |
|---|---|
| Previous Daily High | 140.25 |
| Previous Daily Low | 139.02 |
| Previous Weekly High | 140.93 |
| Previous Weekly Low | 138.43 |
| Previous Monthly High | 140.93 |
| Previous Monthly Low | 133.50 |
| Daily Fibonacci 38.2% | 139.78 |
| Daily Fibonacci 61.8% | 139.49 |
| Daily Pivot Point S1 | 139.34 |
| Daily Pivot Point S2 | 138.57 |
| Daily Pivot Point S3 | 138.12 |
| Daily Pivot Point R1 | 140.56 |
| Daily Pivot Point R2 | 141.01 |
| Daily Pivot Point R3 | 141.78 |
[/s2If]
Nehcap Expert Advisor
The NEHCAP MT4 EA is high quality professional trading system geared to generate returns without using GRID or martingales. Each trade has strict risk per trade parameter. The pairs under management include EURUSD, GBPUSD, AUDCAD, AUDNZD,GBPAUD, EURAUD, EURCAD, CHFJPY and many more.
The system is trading live: LIVE ACCOUNT TRACKING
You can run it free. Apply for a free trial and track our account. Buy the system or use profit share mechanism to generate returns on your MT4.
Join Our Telegram Group
")


