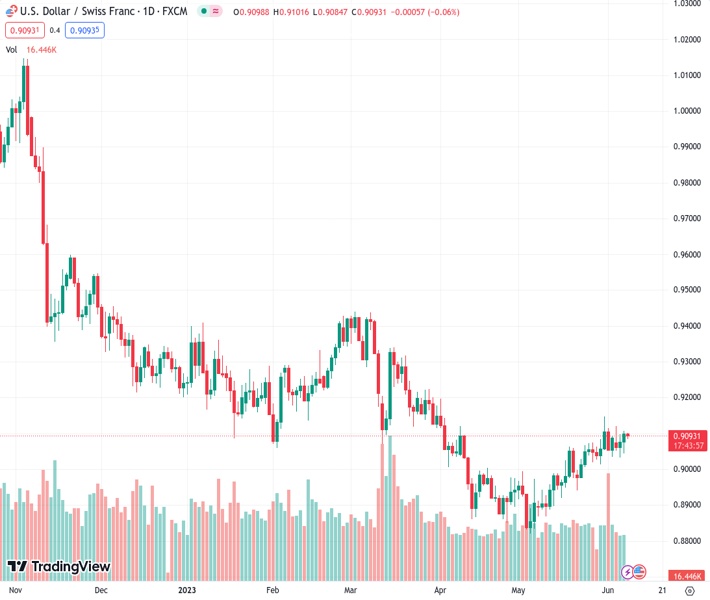
#USDCHF @ 0.90924 oscillates in a narrow trading band through the Asian session on Thursday. (Pivot Orderbook analysis)
…
This is a premium post.
[s2If !current_user_can(access_s2member_level4)]Please register for FREE REGISTER to read full post below containing analysis. In case of any error or you think you are not able to read the full post below, please email us at support#nehcap.com [lwa][/s2If] [s2If current_user_can(access_s2member_level1)]
- USD/CHF oscillates in a narrow trading band through the Asian session on Thursday.
- The cautious mood benefits the safe-haven CHF and caps gains amid subdued USD.
- Reviving bets more Fed rate hikes lift the US bond yields and lend support to the buck.
The pair currently trades last at 0.90924.
The previous day high was 0.9107 while the previous day low was 0.9043. The daily 38.2% Fib levels comes at 0.9083, expected to provide support. Similarly, the daily 61.8% fib level is at 0.9068, expected to provide support.
The USD/CHF pair struggles to capitalize on its gains recorded over the past two days and oscillates in a narrow trading band through the Asian session on Thursday. Spot prices currently trade below the 0.9100 mark, with bulls still awaiting a sustained move beyond a technically significant 100-day Simple Moving Average (SMA) before placing fresh bets.
The prevalent cautious mood lends some support to the safe-haven Swiss Franc (CHF), which, along with subdued US Dollar (USD) price action, acts as a headwind for the USD/CHF pair. The market sentiment remains fragile in the wake of worries about a global economic sentiment, fueled by dismal Chinese macro data released on Wednesday. In fact, China’s trade surplus sank to a 13-month low in May, led by a surprise tumble in exports. This suggests that overseas demand for Chinese goods remained weak and poses additional challenges for the world’s second-largest economy, tempering investors’ appetite for riskier assets.
The USD, on the other hand, is oscillating in a familiar range over the past two weeks or so as market players seem uncertain over the Federal Reserve’s (Fed) next policy move. Last week’s dovish rhetoric by several Fed officials fueled speculations that the US central bank will keep interest rates unchanged at its upcoming monetary policy meeting on June 13-14. That said, the inflation and labor market data kept alive hopes for a 25 bps lift-off next week. Moreover, surprise rate hikes by the Reserve Bank of Australia (RBA) and the Bank of Canada (BoC) this week suggest that the fight against inflation is still not over yet.
The prospects for further policy tightening by the Fed remain supportive of elevated US Treasury bond yields, which favours the USD bulls and should help limit the downside for the USD/CHF pair. That said, it will still be prudent to wait for a sustained breakout through the 100-day SMA before positioning for an extension of over a one-month-old uptrend. Traders now look to the release of the Weekly Initial Jobless Claims data from the US, due later during the North American session. This, along with the US bond yields, will influence the USD price dynamics and provide a fresh impetus to the major.
Technical Levels: Supports and Resistances
USDCHF currently trading at 0.9094 at the time of writing. Pair opened at 0.9102 and is trading with a change of -0.09 % .
| Overview | Overview.1 | |
|---|---|---|
| 0 | Today last price | 0.9094 |
| 1 | Today Daily Change | -0.0008 |
| 2 | Today Daily Change % | -0.0900 |
| 3 | Today daily open | 0.9102 |
The pair is trading above its 20 Daily moving average @ 0.9031, above its 50 Daily moving average @ 0.8994 , below its 100 Daily moving average @ 0.9123 and below its 200 Daily moving average @ 0.9366
| Trends | Trends.1 | |
|---|---|---|
| 0 | Daily SMA20 | 0.9031 |
| 1 | Daily SMA50 | 0.8994 |
| 2 | Daily SMA100 | 0.9123 |
| 3 | Daily SMA200 | 0.9366 |
The previous day high was 0.9107 while the previous day low was 0.9043. The daily 38.2% Fib levels comes at 0.9083, expected to provide support. Similarly, the daily 61.8% fib level is at 0.9068, expected to provide support.
Note the levels of interest below:
- Pivot support is noted at 0.9061, 0.902, 0.8997
- Pivot resistance is noted at 0.9125, 0.9148, 0.9189
| Levels | Levels.1 |
|---|---|
| Previous Daily High | 0.9107 |
| Previous Daily Low | 0.9043 |
| Previous Weekly High | 0.9148 |
| Previous Weekly Low | 0.9014 |
| Previous Monthly High | 0.9148 |
| Previous Monthly Low | 0.8820 |
| Daily Fibonacci 38.2% | 0.9083 |
| Daily Fibonacci 61.8% | 0.9068 |
| Daily Pivot Point S1 | 0.9061 |
| Daily Pivot Point S2 | 0.9020 |
| Daily Pivot Point S3 | 0.8997 |
| Daily Pivot Point R1 | 0.9125 |
| Daily Pivot Point R2 | 0.9148 |
| Daily Pivot Point R3 | 0.9189 |
[/s2If]
Nehcap Expert Advisor
The NEHCAP MT4 EA is high quality professional trading system geared to generate returns without using GRID or martingales. Each trade has strict risk per trade parameter. The pairs under management include EURUSD, GBPUSD, AUDCAD, AUDNZD,GBPAUD, EURAUD, EURCAD, CHFJPY and many more.
The system is trading live: LIVE ACCOUNT TRACKING
You can run it free. Apply for a free trial and track our account. Buy the system or use profit share mechanism to generate returns on your MT4.
Join Our Telegram Group
")


