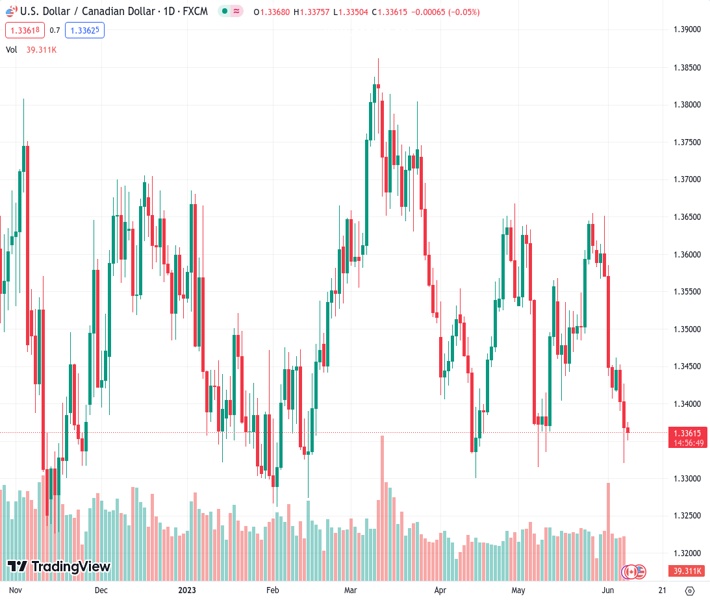
#USDCAD @ 1.33640 remains pressured for the third consecutive day at the lowest level in a month. (Pivot Orderbook analysis)
…
This is a premium post.
[s2If !current_user_can(access_s2member_level4)]Please register for FREE REGISTER to read full post below containing analysis. In case of any error or you think you are not able to read the full post below, please email us at support#nehcap.com [lwa][/s2If] [s2If current_user_can(access_s2member_level1)]
- USD/CAD remains pressured for the third consecutive day at the lowest level in a month.
- BoC traces RBA’s moves to surprise market with 0.25% rate hike to tame inflation woes.
- WTI crude oil remains depressed on demand-supply fears, ignores US Dollar’s two-day losing streak.
- Speech from BoC’s Beaudry, Canada employment data eyed ahead of next week’s FOMC.
The pair currently trades last at 1.33640.
The previous day high was 1.3427 while the previous day low was 1.3321. The daily 38.2% Fib levels comes at 1.3361, expected to provide support. Similarly, the daily 61.8% fib level is at 1.3386, expected to provide resistance.
USD/CAD fades bounce off intraday low as it drops to 1.3360 heading into Thursday’s European session, after refreshing the monthly bottom at 1.3320 the previous day. In doing so, the Loonie pair cheers the US Dollar weakness while paying little heed to the mildly offered WTI crude oil price, which is Canada’s main export earner.
On Wednesday, the Bank of Canada (BoC) surprised markets by announcing 25 basis points (bps) increase to increase the benchmark interest rate, to 4.75%, versus market expectations supporting no change in the previous rate of 4.50%. In its policy statement, the BoC said that concerns have increased that Consumer Price Index (CPI) inflation could get stuck materially above the 2% target. That said, the BoC statement appeared dovish as it removed the April language about how the Canadian central bank is prepared to raise rates further if needed.
Elsewhere, WTI crude oil prints mild losses near $72.50 while failing to extend the previous day’s corrective bounce, eyes the second consecutive weekly loss. In doing so, black gold bears the burden of the market’s fears of slower economic growth due to hawkish central bank actions.
It should be noted, however, that the US Dollar Index (DXY) remains pressured despite jittery markets amid the latest increase in the bets on the Federal Reserve’s 25 bps rate hike in July, even as the June Federal Open Market Committee (FOMC) is likely to keep the rates unchanged.
Against this backdrop, S&P500 Futures extend Wednesday’s losses to 4,265, down 0.25% intraday, whereas the US 10-year Treasury bond yields grind near 3.79% after rising the most in five weeks the previous day.
Looking ahead, comments from Bank of Canada (BoC) Deputy Governor Paul Beaudry and Canada’s monthly jobs report will be the key to watching for clear directions ahead of next week’s Fed meeting.
Despite the latest weakness, the USD/CAD pair is yet to smash a seven-month-old ascending support line, around 1.3330 at the latest, which in turn joins the nearly oversold RSI (14) line to suggest a corrective bounce in price.
Technical Levels: Supports and Resistances
USDCAD currently trading at 1.3354 at the time of writing. Pair opened at 1.3369 and is trading with a change of -0.11% % .
| Overview | Overview.1 | |
|---|---|---|
| 0 | Today last price | 1.3354 |
| 1 | Today Daily Change | -0.0015 |
| 2 | Today Daily Change % | -0.11% |
| 3 | Today daily open | 1.3369 |
The pair remains strongly bearish on the daily time frame. It trades below the 20 SMA @ 1.3509, 50 SMA 1.3495, 100 SMA @ 1.3517 and 200 SMA @ 1.3512.
| Trends | Trends.1 | |
|---|---|---|
| 0 | Daily SMA20 | 1.3509 |
| 1 | Daily SMA50 | 1.3495 |
| 2 | Daily SMA100 | 1.3517 |
| 3 | Daily SMA200 | 1.3512 |
The previous day high was 1.3427 while the previous day low was 1.3321. The daily 38.2% Fib levels comes at 1.3361, expected to provide support. Similarly, the daily 61.8% fib level is at 1.3386, expected to provide resistance.
Note the levels of interest below:
- Pivot support is noted at 1.3318, 1.3266, 1.3212
- Pivot resistance is noted at 1.3424, 1.3478, 1.3529
| Levels | Levels.1 |
|---|---|
| Previous Daily High | 1.3427 |
| Previous Daily Low | 1.3321 |
| Previous Weekly High | 1.3651 |
| Previous Weekly Low | 1.3407 |
| Previous Monthly High | 1.3655 |
| Previous Monthly Low | 1.3315 |
| Daily Fibonacci 38.2% | 1.3361 |
| Daily Fibonacci 61.8% | 1.3386 |
| Daily Pivot Point S1 | 1.3318 |
| Daily Pivot Point S2 | 1.3266 |
| Daily Pivot Point S3 | 1.3212 |
| Daily Pivot Point R1 | 1.3424 |
| Daily Pivot Point R2 | 1.3478 |
| Daily Pivot Point R3 | 1.3529 |
[/s2If]
Nehcap Expert Advisor
The NEHCAP MT4 EA is high quality professional trading system geared to generate returns without using GRID or martingales. Each trade has strict risk per trade parameter. The pairs under management include EURUSD, GBPUSD, AUDCAD, AUDNZD,GBPAUD, EURAUD, EURCAD, CHFJPY and many more.
The system is trading live: LIVE ACCOUNT TRACKING
You can run it free. Apply for a free trial and track our account. Buy the system or use profit share mechanism to generate returns on your MT4.
Join Our Telegram Group
")


