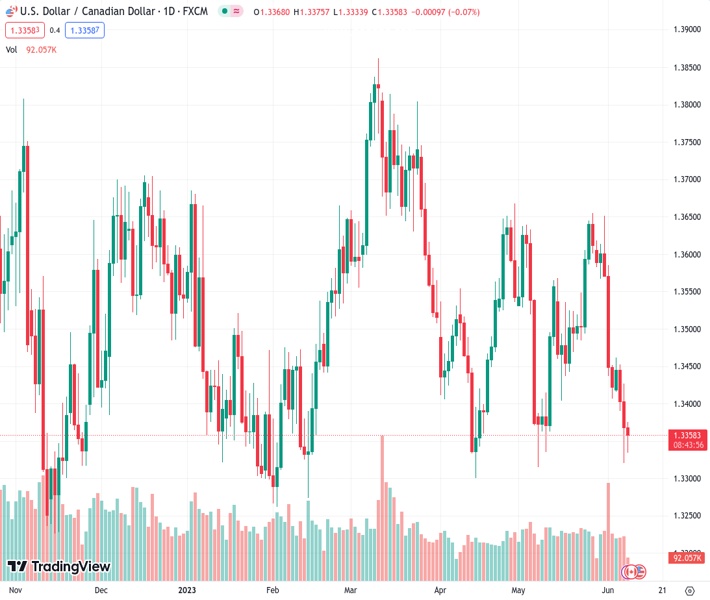
#USDCAD @ 1.33576 has shown recovery to near 1.3360 despite a correction in the USD Index. (Pivot Orderbook analysis)
…
This is a premium post.
[s2If !current_user_can(access_s2member_level4)]Please register for FREE REGISTER to read full post below containing analysis. In case of any error or you think you are not able to read the full post below, please email us at support#nehcap.com [lwa][/s2If] [s2If current_user_can(access_s2member_level1)]
- USD/CAD has shown recovery to near 1.3360 despite a correction in the USD Index.
- The BoC surprisingly raised interest rates due to resilience in the Canadian economy.
- The oil price has renewed its three-day high at $73.20 as various state-run banks in China have slashed their lending rates.
The pair currently trades last at 1.33576.
The previous day high was 1.3427 while the previous day low was 1.3321. The daily 38.2% Fib levels comes at 1.3361, expected to provide resistance. Similarly, the daily 61.8% fib level is at 1.3386, expected to provide resistance.
The USD/CAD pair has witnessed buying interest around 1.3340 in the last London session. The Loonie asset has rebounded to near 1.3360 despite a solid recovery in the oil price and soaring expectations of one more interest rate hike from the Bank of Canada (BoC).
S&P500 futures are holding nominal losses in the European session, portraying a cautious market mood. The risk profile has turned filthy as investors are anticipating that the Federal Reserve (Fed) will not pause its policy-tightening spell. Earlier, Fed chair Jerome Powell announced that further interest rate hikes are less certain as tight credit conditions by United States’ regional banks are effecting barricading inflation from showing true colors.
The US Dollar Index (DXY) is consistently contracting right from the first tick made on Thursday. On a broader note, the USD Index is demonstrating topsy-turvy moves in a wide range amid an absence of a potential trigger this week. Investors are preparing for the US Consumer Price Index (CPI) (May) data, which will be announced on Tuesday.
The Canadian Dollar is struggling to dominate the US Dollar despite a surprise rate hike announcement by the Bank of Canada (BoC). BoC Governor Tiff Macklem raised interest rates surprisingly by 25 basis points (bps) to 4.75%. Considering the resilience of the Canadian economy due to a solid labor market, and consumer spending, current monetary policy not remained restrictive enough to tame stubborn inflation.
The BoC has kept doors open for further interest rate hikes if inflation continues to remain persistent.
Meanwhile, the oil price has renewed its three-day high at $73.20 as various state-run banks in China have slashed their lending rates for supporting the economic recovery. It is worth noting that Canada is the leading exporter of oil to the United States and higher oil price supports the Canadian Dollar.
Technical Levels: Supports and Resistances
USDCAD currently trading at 1.3359 at the time of writing. Pair opened at 1.3369 and is trading with a change of -0.07 % .
| Overview | Overview.1 | |
|---|---|---|
| 0 | Today last price | 1.3359 |
| 1 | Today Daily Change | -0.0010 |
| 2 | Today Daily Change % | -0.0700 |
| 3 | Today daily open | 1.3369 |
The pair remains strongly bearish on the daily time frame. It trades below the 20 SMA @ 1.3509, 50 SMA 1.3495, 100 SMA @ 1.3517 and 200 SMA @ 1.3512.
| Trends | Trends.1 | |
|---|---|---|
| 0 | Daily SMA20 | 1.3509 |
| 1 | Daily SMA50 | 1.3495 |
| 2 | Daily SMA100 | 1.3517 |
| 3 | Daily SMA200 | 1.3512 |
The previous day high was 1.3427 while the previous day low was 1.3321. The daily 38.2% Fib levels comes at 1.3361, expected to provide resistance. Similarly, the daily 61.8% fib level is at 1.3386, expected to provide resistance.
Note the levels of interest below:
- Pivot support is noted at 1.3318, 1.3266, 1.3212
- Pivot resistance is noted at 1.3424, 1.3478, 1.3529
| Levels | Levels.1 |
|---|---|
| Previous Daily High | 1.3427 |
| Previous Daily Low | 1.3321 |
| Previous Weekly High | 1.3651 |
| Previous Weekly Low | 1.3407 |
| Previous Monthly High | 1.3655 |
| Previous Monthly Low | 1.3315 |
| Daily Fibonacci 38.2% | 1.3361 |
| Daily Fibonacci 61.8% | 1.3386 |
| Daily Pivot Point S1 | 1.3318 |
| Daily Pivot Point S2 | 1.3266 |
| Daily Pivot Point S3 | 1.3212 |
| Daily Pivot Point R1 | 1.3424 |
| Daily Pivot Point R2 | 1.3478 |
| Daily Pivot Point R3 | 1.3529 |
[/s2If]
Nehcap Expert Advisor
The NEHCAP MT4 EA is high quality professional trading system geared to generate returns without using GRID or martingales. Each trade has strict risk per trade parameter. The pairs under management include EURUSD, GBPUSD, AUDCAD, AUDNZD,GBPAUD, EURAUD, EURCAD, CHFJPY and many more.
The system is trading live: LIVE ACCOUNT TRACKING
You can run it free. Apply for a free trial and track our account. Buy the system or use profit share mechanism to generate returns on your MT4.
Join Our Telegram Group
")


