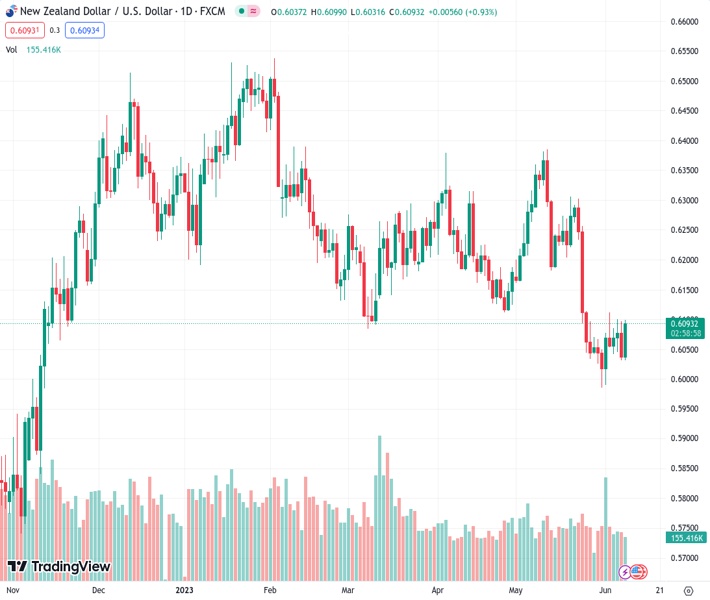
#NZDUSD @ 0.60934 The pair jumped above 0.6090 showing a 0.95% increase on the day. (Pivot Orderbook analysis)
…
This is a premium post.
[s2If !current_user_can(access_s2member_level4)]Please register for FREE REGISTER to read full post below containing analysis. In case of any error or you think you are not able to read the full post below, please email us at support#nehcap.com [lwa][/s2If] [s2If current_user_can(access_s2member_level1)]
- The NZD/USD pair jumped above 0.6090 showing a 0.95% increase on the day.
- US Initial Jobless Claims for the week ending on June 2 increased to 261K.
- Falling US yields amid dovish bets on the Fed weakened the US Dollar.
The pair currently trades last at 0.60934.
The previous day high was 0.6097 while the previous day low was 0.6031. The daily 38.2% Fib levels comes at 0.6056, expected to provide support. Similarly, the daily 61.8% fib level is at 0.6072, expected to provide support.
The NZD/USD pair experienced a significant surge, surpassing the 0.6090 level and marking a 0.95% increase on the day. This rise was influenced by multiple factors, including the US Initial Jobless Claims for the week ending June 2, which unexpectedly accelerated, fueling dovish expectations towards the upcoming Federal Reserve (Fed) meeting. The USD lost interest on the back of falling US bond yields.
US Initial Jobless Claims for the week ending on June 2 came in at 261K vs the 235K expected and accelerated from its previous reading of 233K. The rising number of people claiming unemployment benefits in the US hints at weakness in the labour market amid the contractive monetary policy by the Federal Reserve (Fed) which makes investors foresee a less aggressive stance for the upcoming meetings. The CME FedWatch Tool suggests that investors are placing higher probabilities on the Fed refraining from hiking rates in the next meeting scheduled for June 13-14, and instead, keeping the target rate steady at 5.25%.
Against this backdrop, US bond yields slid across the curve with the 2-, 5- and 10-year rates lower on the day.
The forthcoming US Consumer Price Index (CPI) data is expected to play the most crucial role in determining the Fed decision. Analysts predict a decrease in the year-on-year headline inflation rate to 4.2% in May from the previous 4.9%, while the core rate is anticipated to rise to 5.6% from its previous reading of 5.5%.
According to the daily chart, the NZD/USD holds a short-term neutral to bearish outlook. Despite technical indicator showing growing bullish momentum, the bearish cross performed by the 20-day Simple Moving Average (SMA) sliding below the 200-day SMA suggests that the negative outlook for the NZD is intact.
On the downside, support levels line up at 0.6050, 0.6030 and the psychological mark of 0.6000. On the other hand, immediate resistance is seen at 0.6115, followed by the 0.6130 – 0.6150 zone, where the mentioned SMAs charted the bearish cross.
Technical Levels: Supports and Resistances
NZDUSD currently trading at 0.6095 at the time of writing. Pair opened at 0.6037 and is trading with a change of 0.96 % .
| Overview | Overview.1 | |
|---|---|---|
| 0 | Today last price | 0.6095 |
| 1 | Today Daily Change | 0.0058 |
| 2 | Today Daily Change % | 0.9600 |
| 3 | Today daily open | 0.6037 |
The pair remains strongly bearish on the daily time frame. It trades below the 20 SMA @ 0.6138, 50 SMA 0.6194, 100 SMA @ 0.624 and 200 SMA @ 0.6149.
| Trends | Trends.1 | |
|---|---|---|
| 0 | Daily SMA20 | 0.6138 |
| 1 | Daily SMA50 | 0.6194 |
| 2 | Daily SMA100 | 0.6240 |
| 3 | Daily SMA200 | 0.6149 |
The previous day high was 0.6097 while the previous day low was 0.6031. The daily 38.2% Fib levels comes at 0.6056, expected to provide support. Similarly, the daily 61.8% fib level is at 0.6072, expected to provide support.
Note the levels of interest below:
- Pivot support is noted at 0.6013, 0.5989, 0.5947
- Pivot resistance is noted at 0.6079, 0.6121, 0.6145
| Levels | Levels.1 |
|---|---|
| Previous Daily High | 0.6097 |
| Previous Daily Low | 0.6031 |
| Previous Weekly High | 0.6112 |
| Previous Weekly Low | 0.5985 |
| Previous Monthly High | 0.6385 |
| Previous Monthly Low | 0.5985 |
| Daily Fibonacci 38.2% | 0.6056 |
| Daily Fibonacci 61.8% | 0.6072 |
| Daily Pivot Point S1 | 0.6013 |
| Daily Pivot Point S2 | 0.5989 |
| Daily Pivot Point S3 | 0.5947 |
| Daily Pivot Point R1 | 0.6079 |
| Daily Pivot Point R2 | 0.6121 |
| Daily Pivot Point R3 | 0.6145 |
[/s2If]
Nehcap Expert Advisor
The NEHCAP MT4 EA is high quality professional trading system geared to generate returns without using GRID or martingales. Each trade has strict risk per trade parameter. The pairs under management include EURUSD, GBPUSD, AUDCAD, AUDNZD,GBPAUD, EURAUD, EURCAD, CHFJPY and many more.
The system is trading live: LIVE ACCOUNT TRACKING
You can run it free. Apply for a free trial and track our account. Buy the system or use profit share mechanism to generate returns on your MT4.
Join Our Telegram Group
")


