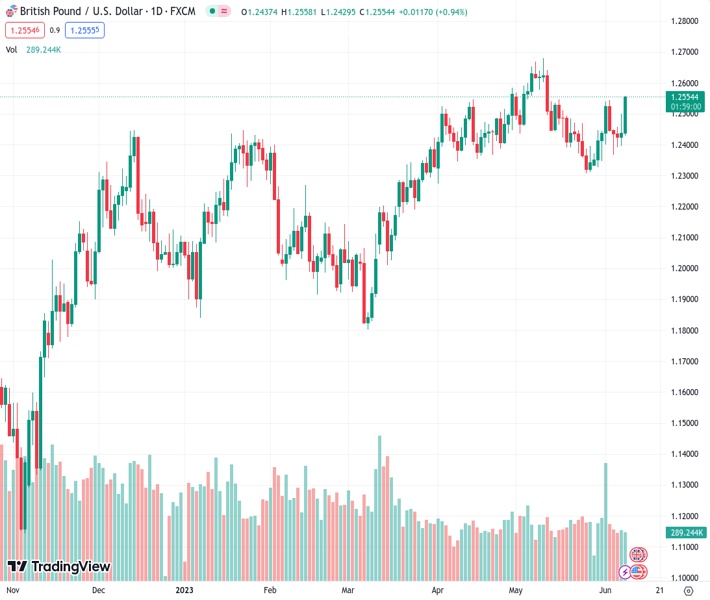
#GBPUSD @ 1.25547 skyrockets as US Jobless Claims soar; investors expect Fed pause. (Pivot Orderbook analysis)
…
This is a premium post.
[s2If !current_user_can(access_s2member_level4)]Please register for FREE REGISTER to read full post below containing analysis. In case of any error or you think you are not able to read the full post below, please email us at support#nehcap.com [lwa][/s2If] [s2If current_user_can(access_s2member_level1)]
- GBP/USD skyrockets as US Jobless Claims soar; investors expect Fed pause.
- US Treasury bond yields pressured, USD Index collapsed by 0.73%.
- BoE anticipated rate hike cushions GBP amid sparse economic data.
The pair currently trades last at 1.25547.
The previous day high was 1.25 while the previous day low was 1.2395. The daily 38.2% Fib levels comes at 1.246, expected to provide support. Similarly, the daily 61.8% fib level is at 1.2435, expected to provide support.
GBP/USD rallies above 1.2500 as labor market data from the United States (US) keeps investors expecting a pause on the Federal Reserve (Fed) hiking cycle. The lack of economic data to be revealed in the UK, alongside traders betting for Bank of England’s (BoE) additional tightening, underpins the GBP/USD. The GBP/USD trades at 1.2550 after hitting a low of 1.2429.
The GBP/USD advances aggressively following last week’s Initial Jobless Claims report. The US Department of Labor revealed an increase of 261K unemployment claims, above estimates of 232K, the highest record since October 2021. Continuing Claims dropped 37K to 1.757M in the week ending May 27. The report justifies the Fed’s view of skipping an interest rate increase in June, though next week’s inflation report could shift expectations one day before the decision.
In the fixed-income sphere, US Treasury bond yields are under pressure, with 2s and 10s losing four and eight basis points, respectively, at 4.515%, and 3.716%, a headwind for the greenback. The US Dollar Index, which measures the performance of a basket of six currencies vs. the buck, collapses by 0.73%, at 103.345.
Across the pond, estimates that the Bank of England will continue to lift rates cushioned Pound Sterling (GBP) fall at the beginning of the week. Money market futures estimate the BoE will hike 100 bps towards the year-end. That means the Bank Rate will hit 5.50%.
Upcoming events.
Friday’s economic calendar is absent for both countries, but the next week, it will pick up some steam. On Tuesday, the UK will update the labor market status. Meanwhile, the US Consumer Price Index (CPI) will shed some light and could view by Fed officials, who begin the monetary policy meeting on the same day.
The GBP/USD recovered from its losses and advanced comfortably above 1.2500, with buyers eyeing year-to-date (YTD) highs at around 1.2679. Technical indicators cement the case for an uptrend, with the Relative Strength Index (RSI) reaching new peaks, while the three-day Rate of Change (RoC) depicts buyers gathering momentum. Upside risks lie at the 1.2600 figure, followed by the YTD high, ahead of the 1.2700 mark. On the flip side, the June 7 high-turned support at 1.2499 is the first support, immediately followed by the 20-day Exponential Moving Average (EMA) at 1.2450 before diving to the 50-day EMA at 1.2416.
Technical Levels: Supports and Resistances
GBPUSD currently trading at 1.2556 at the time of writing. Pair opened at 1.2437 and is trading with a change of 0.96 % .
| Overview | Overview.1 | |
|---|---|---|
| 0 | Today last price | 1.2556 |
| 1 | Today Daily Change | 0.0119 |
| 2 | Today Daily Change % | 0.9600 |
| 3 | Today daily open | 1.2437 |
The pair remains strongly bullish on the daily timeframe. It trades above its 20 SMA @ 1.2434, 50 SMA 1.246, 100 SMA @ 1.2305 and 200 SMA @ 1.2006.
| Trends | Trends.1 | |
|---|---|---|
| 0 | Daily SMA20 | 1.2434 |
| 1 | Daily SMA50 | 1.2460 |
| 2 | Daily SMA100 | 1.2305 |
| 3 | Daily SMA200 | 1.2006 |
The previous day high was 1.25 while the previous day low was 1.2395. The daily 38.2% Fib levels comes at 1.246, expected to provide support. Similarly, the daily 61.8% fib level is at 1.2435, expected to provide support.
Note the levels of interest below:
- Pivot support is noted at 1.2388, 1.2339, 1.2283
- Pivot resistance is noted at 1.2493, 1.2549, 1.2598
| Levels | Levels.1 |
|---|---|
| Previous Daily High | 1.2500 |
| Previous Daily Low | 1.2395 |
| Previous Weekly High | 1.2545 |
| Previous Weekly Low | 1.2327 |
| Previous Monthly High | 1.2680 |
| Previous Monthly Low | 1.2308 |
| Daily Fibonacci 38.2% | 1.2460 |
| Daily Fibonacci 61.8% | 1.2435 |
| Daily Pivot Point S1 | 1.2388 |
| Daily Pivot Point S2 | 1.2339 |
| Daily Pivot Point S3 | 1.2283 |
| Daily Pivot Point R1 | 1.2493 |
| Daily Pivot Point R2 | 1.2549 |
| Daily Pivot Point R3 | 1.2598 |
[/s2If]
Nehcap Expert Advisor
The NEHCAP MT4 EA is high quality professional trading system geared to generate returns without using GRID or martingales. Each trade has strict risk per trade parameter. The pairs under management include EURUSD, GBPUSD, AUDCAD, AUDNZD,GBPAUD, EURAUD, EURCAD, CHFJPY and many more.
The system is trading live: LIVE ACCOUNT TRACKING
You can run it free. Apply for a free trial and track our account. Buy the system or use profit share mechanism to generate returns on your MT4.
Join Our Telegram Group
")


