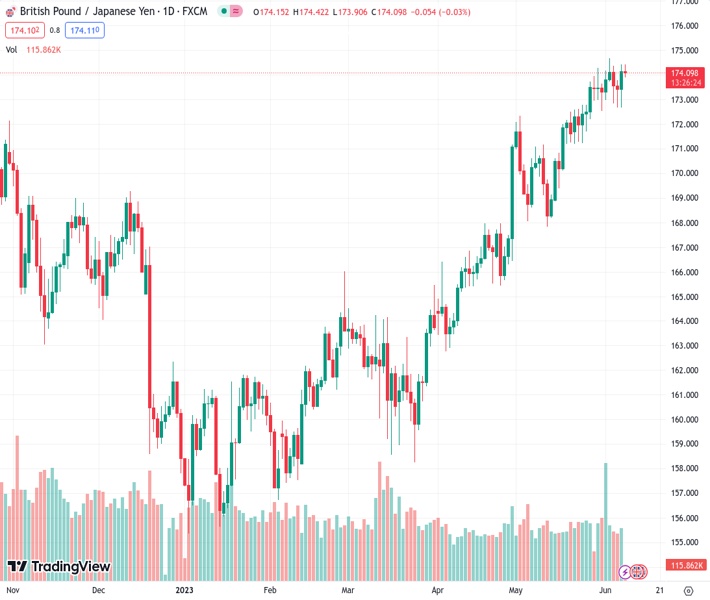
#GBPJPY @ 174.074 oscillates in a narrow trading band through the early European session on Thursday. (Pivot Orderbook analysis)
…
This is a premium post.
[s2If !current_user_can(access_s2member_level4)]Please register for FREE REGISTER to read full post below containing analysis. In case of any error or you think you are not able to read the full post below, please email us at support#nehcap.com [lwa][/s2If] [s2If current_user_can(access_s2member_level1)]
- GBP/JPY oscillates in a narrow trading band through the early European session on Thursday.
- Intervention fears, the cautious mood benefit the safe-haven JPY and cap gains for the cross.
- Bets for more rate hikes by the BoE underpin the British Pound and help limit the downside.
The pair currently trades last at 174.074.
The previous day high was 174.43 while the previous day low was 172.67. The daily 38.2% Fib levels comes at 173.76, expected to provide support. Similarly, the daily 61.8% fib level is at 173.34, expected to provide support.
The GBP/JPY cross struggles to capitalize on the previous day’s goodish recovery of over 175 pips from the 172.65 area, or a one-and-half-week low and edges lower on Thursday. Spot prices remain on the defensive heading into the European session and currently hover near the lower end of the narrow intraday trading band, just above the 174.00 mark.
The Japanese Yen (JPY) continues to draw some support from the prospects for more sizeable interventions by the Bank of Japan (BoJ) to support the domestic currency. Apart from this, the prevalent cautious mood benefits the JPY’s relative safe-haven status and acts as a headwind for the GBP/JPY cross. The market sentiment remains fragile amid worries about a global economic slowdown, particularly in China. In fact, data released on Wednesday showed that China’s trade surplus sank to a 13-month low in May, led by a slump in exports. This, in turn, indicates weak overseas demand for Chinese goods and poses additional challenges for the world’s second-largest economy.
Adding to this, the Organization for Economic Co-operation and Development (OECD) forecasts that the global economy is set for a weak recovery over the coming years as persistent core inflation and tighter monetary policy weigh on demand. OECD now expects the global economy to expand by 2.7% this year. Excluding the pandemic-hit year of 2020, this would still be the lowest annual rate of growth since the 2008-2009 financial crisis. The downside for the GBP/JPY cross, however, remains cushioned on the back of expectations that the Bank of England (BoE) will be far more aggressive in policy tightening to contain stubbornly high inflation, which underpins the British Pound.
In fact, investors now anticipate the UK central bank to raise interest rates again from 4.5% to 4.75% on June 22 and see a roughly 60% chance that rate will peak at 5.5% later this year. The bets were lifted by the official data released last week, which showed that the headline UK CPI fell less than expected in April and a closely watched measure of core price surged to a 31-year high. This, in turn, suggests that the path of least resistance for the GBP/JPY cross is to the upside and supports prospects for an extension of a multi-week-old upward trajectory. Bullish traders, however, might wait for some follow-through buying beyond the 174.65-174.7 area, or the monthly peak before placing fresh bets.
Technical Levels: Supports and Resistances
GBPJPY currently trading at 174.09 at the time of writing. Pair opened at 174.28 and is trading with a change of -0.11 % .
| Overview | Overview.1 | |
|---|---|---|
| 0 | Today last price | 174.09 |
| 1 | Today Daily Change | -0.19 |
| 2 | Today Daily Change % | -0.11 |
| 3 | Today daily open | 174.28 |
The pair remains strongly bullish on the daily timeframe. It trades above its 20 SMA @ 172.34, 50 SMA 169.2, 100 SMA @ 165.26 and 200 SMA @ 164.66.
| Trends | Trends.1 | |
|---|---|---|
| 0 | Daily SMA20 | 172.34 |
| 1 | Daily SMA50 | 169.20 |
| 2 | Daily SMA100 | 165.26 |
| 3 | Daily SMA200 | 164.66 |
The previous day high was 174.43 while the previous day low was 172.67. The daily 38.2% Fib levels comes at 173.76, expected to provide support. Similarly, the daily 61.8% fib level is at 173.34, expected to provide support.
Note the levels of interest below:
- Pivot support is noted at 173.16, 172.03, 171.39
- Pivot resistance is noted at 174.92, 175.56, 176.69
| Levels | Levels.1 |
|---|---|
| Previous Daily High | 174.43 |
| Previous Daily Low | 172.67 |
| Previous Weekly High | 174.68 |
| Previous Weekly Low | 172.53 |
| Previous Monthly High | 174.28 |
| Previous Monthly Low | 167.84 |
| Daily Fibonacci 38.2% | 173.76 |
| Daily Fibonacci 61.8% | 173.34 |
| Daily Pivot Point S1 | 173.16 |
| Daily Pivot Point S2 | 172.03 |
| Daily Pivot Point S3 | 171.39 |
| Daily Pivot Point R1 | 174.92 |
| Daily Pivot Point R2 | 175.56 |
| Daily Pivot Point R3 | 176.69 |
[/s2If]
Nehcap Expert Advisor
The NEHCAP MT4 EA is high quality professional trading system geared to generate returns without using GRID or martingales. Each trade has strict risk per trade parameter. The pairs under management include EURUSD, GBPUSD, AUDCAD, AUDNZD,GBPAUD, EURAUD, EURCAD, CHFJPY and many more.
The system is trading live: LIVE ACCOUNT TRACKING
You can run it free. Apply for a free trial and track our account. Buy the system or use profit share mechanism to generate returns on your MT4.
Join Our Telegram Group
")


