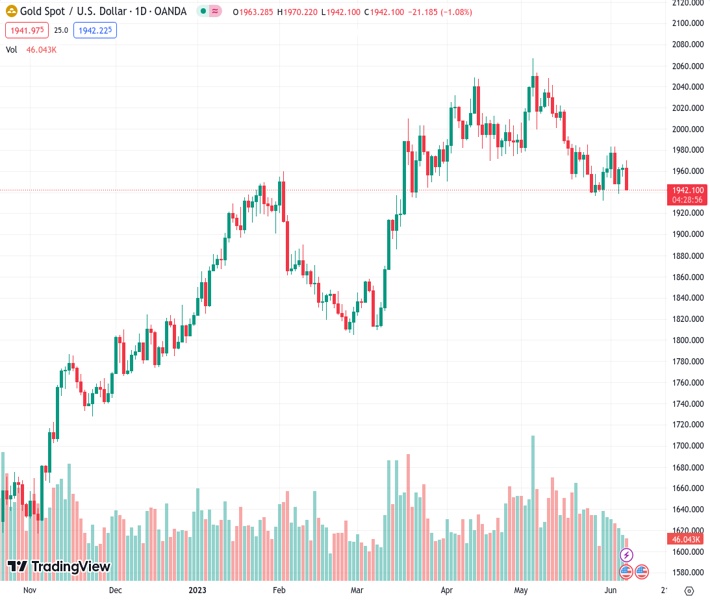
#XAUUSD @ 1,942.82 Gold prices decline, hindered by rising US bond yields and the greenback’s resilience; is down 0.50%. (Pivot Orderbook analysis)
…
This is a premium post.
[s2If !current_user_can(access_s2member_level4)]Please register for FREE REGISTER to read full post below containing analysis. In case of any error or you think you are not able to read the full post below, please email us at support#nehcap.com [lwa][/s2If] [s2If current_user_can(access_s2member_level1)]
- Gold prices decline, hindered by rising US bond yields and the greenback’s resilience; XAU/USD is down 0.50%.
- Gloomy global economic outlook impacts sentiment, with disappointing export data from China and broadened US trade deficit.
- The US dollar gains momentum as the US Dollar Index (DXY) pares earlier losses, adding pressure on gold prices.
The pair currently trades last at 1942.82.
The previous day high was 1966.43 while the previous day low was 1954.43. The daily 38.2% Fib levels comes at 1961.85, expected to provide resistance. Similarly, the daily 61.8% fib level is at 1959.01, expected to provide resistance.
Gold price retraces after facing solid resistance at the confluence of technical indicators, as well as weighed by rising US Treasury bond yields and a gloomy global economic outlook, with China’s export falling more than estimates. The XAU/USD is trading at $1952.36, down 0.50%, after hitting a daily high of $1970.15.
XAU/USD is on the defensive, weighed by high US bond yields, with the 10-year benchmark note climbing more than ten bps, at 3.774%. US real yields are heading towards the 1.60% region, a headwind for the yellow metal. China’s data revealed that Exports declined 7.5% YoY in US Dollar terms, below estimates for a 1.8% drop; meanwhile, Imports fell a less-than-forecasts at 4.5% YoY in May, vs. an 8.1% plunge.
The greenback shifted positively, printing gains as shown by the US Dollar Index (DXY). The DXY, which tracks the USD performance against a basket of six currencies, pares its earlier losses, up 0.04%, at 104.078.
Risk aversion is another factor impacting Gold prices as Wall Street tumbles. The trade deficit in the United States broadened, as reported by the Bureau of Economic Analysis (BEA), mainly attributed to A notable dip in exports contributed to this shift, while imports rose sharply. The Balance of Trade came at $-74.6B in April of 2023, vs. March’s $-60.B. Exports declined compared to April, came at $249B vs. $258.2B, while imports rose by $323B above March’s $318.8B.
XAU/USD remains consolidated, capped within the boundaries delineated by the 20 and 100-day Exponential Moving Averages (EMAs), each at $1968.35 and $1937.43. The Relative Strength Index (RSI) indicator remains in bearish territory, while the 3-day Rate of Change (RoC) confirms a bearish bias in the near term. Therefore, the XAU/USD first support would be the 100-day EMA, followed by the $1900 figure. A breach of the latter will expose the 200-day EMA at $1889.01. Conversely, if XAU/USD buyers reclaim the confluence of the 20 and 50-day EMA at around $1968-$1970, that would open the door for a rally toward the $2000 mark.
Technical Levels: Supports and Resistances
XAUUSD currently trading at 1947.25 at the time of writing. Pair opened at 1963.6 and is trading with a change of -0.83 % .
| Overview | Overview.1 | |
|---|---|---|
| 0 | Today last price | 1947.25 |
| 1 | Today Daily Change | -16.35 |
| 2 | Today Daily Change % | -0.83 |
| 3 | Today daily open | 1963.60 |
The pair is trading below its 20 Daily moving average @ 1974.4, below its 50 Daily moving average @ 1991.22 , above its 100 Daily moving average @ 1940.0 and above its 200 Daily moving average @ 1837.93
| Trends | Trends.1 | |
|---|---|---|
| 0 | Daily SMA20 | 1974.40 |
| 1 | Daily SMA50 | 1991.22 |
| 2 | Daily SMA100 | 1940.00 |
| 3 | Daily SMA200 | 1837.93 |
The previous day high was 1966.43 while the previous day low was 1954.43. The daily 38.2% Fib levels comes at 1961.85, expected to provide resistance. Similarly, the daily 61.8% fib level is at 1959.01, expected to provide resistance.
Note the levels of interest below:
- Pivot support is noted at 1956.54, 1949.49, 1944.54
- Pivot resistance is noted at 1968.54, 1973.49, 1980.54
| Levels | Levels.1 |
|---|---|
| Previous Daily High | 1966.43 |
| Previous Daily Low | 1954.43 |
| Previous Weekly High | 1983.50 |
| Previous Weekly Low | 1932.12 |
| Previous Monthly High | 2079.76 |
| Previous Monthly Low | 1932.12 |
| Daily Fibonacci 38.2% | 1961.85 |
| Daily Fibonacci 61.8% | 1959.01 |
| Daily Pivot Point S1 | 1956.54 |
| Daily Pivot Point S2 | 1949.49 |
| Daily Pivot Point S3 | 1944.54 |
| Daily Pivot Point R1 | 1968.54 |
| Daily Pivot Point R2 | 1973.49 |
| Daily Pivot Point R3 | 1980.54 |
[/s2If]
Nehcap Expert Advisor
The NEHCAP MT4 EA is high quality professional trading system geared to generate returns without using GRID or martingales. Each trade has strict risk per trade parameter. The pairs under management include EURUSD, GBPUSD, AUDCAD, AUDNZD,GBPAUD, EURAUD, EURCAD, CHFJPY and many more.
The system is trading live: LIVE ACCOUNT TRACKING
You can run it free. Apply for a free trial and track our account. Buy the system or use profit share mechanism to generate returns on your MT4.
Join Our Telegram Group
")


