#USDCHF @ 0.90916 shows bullish momentum, targeting the 0.9100 mark with 0.27% gains. (Pivot Orderbook analysis)
…
This is a premium post.
[s2If !current_user_can(access_s2member_level4)]Please register for FREE REGISTER to read full post below containing analysis. In case of any error or you think you are not able to read the full post below, please email us at support#nehcap.com [lwa][/s2If] [s2If current_user_can(access_s2member_level1)]
- USD/CHF shows bullish momentum, targeting the 0.9100 mark with 0.27% gains.
- RSI and three-day RoC indicators suggest bullish dominance despite sideways movement.
- Overcoming the 0.9120 hurdles could steer the USD/CHF toward the 0.9147 and 0.9200 landmarks.
The pair currently trades last at 0.90916.
The previous day high was 0.9098 while the previous day low was 0.9034. The daily 38.2% Fib levels comes at 0.9073, expected to provide support. Similarly, the daily 61.8% fib level is at 0.9058, expected to provide support.
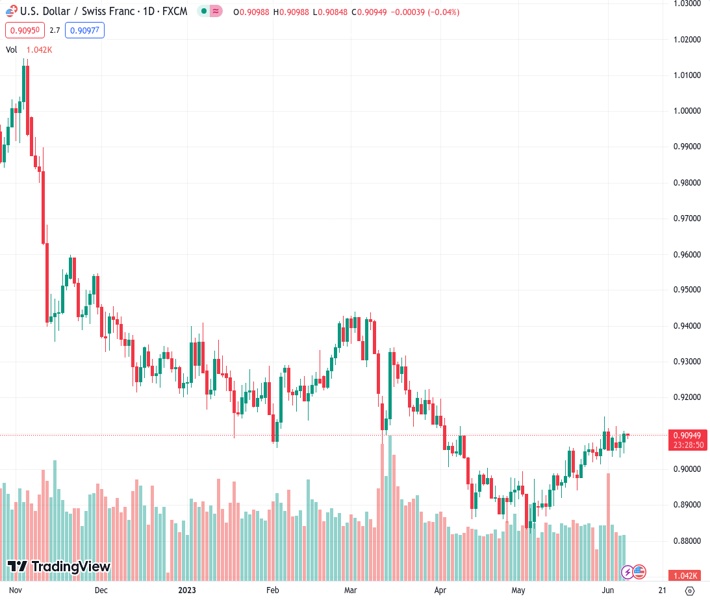
USD/CHF bounces off the 50-day Exponential Moving Average (EMA) and threatens to claim the 0.9100 figure late after Wall Street closed. The US Dollar (USD), propelled by risk aversion, helped the USD/CHF to Regusters solid gains of 0.27%. At the time of writing, the USD/CHF is trading at 0.9090 after hitting a low of 0.9043.
From the USD/CHF daily chart perspective, the pair is neutrally biased, consolidated within the limits of solid support found around the 20- and 50-day EMAs, each at 0.9036 and 0.9040) and resistance at the 100-day EMA at 0.9123. Although price action remains sideways, the Relative Strength Index (RSI) shows bulls are in charge, further cemented by the three-day Rate of Change (RoC). Hence, the USD/CHF path of least resistance is upwards. Of note, the Average True Range (ATR) suggests that volatility in the pair could lean up to 60 pips.
Dialing into the USD/CHF hourly chart, price action remains sideways, though it broke above a resistance trendline late in the New York session, exacerbating a rally above 0.9100. However, buyers must reclaim the weekly high of 0.9120, so they can pose a threat toward the last week’s high of 0.9128. The breach of those levels will pave the way towards the R1 daily pivot at 0.9147, ahead of challenging the 0.9200 figure. Conversely, a fall below the daily pivot at 0.9083 could open the door towards the EMAs at around 0.9074/76, followed by the 200-EMA at 0.9065.
Technical Levels: Supports and Resistances
USDCHF currently trading at 0.9102 at the time of writing. Pair opened at 0.9076 and is trading with a change of 0.29 % .
| Overview | Overview.1 | |
|---|---|---|
| 0 | Today last price | 0.9102 |
| 1 | Today Daily Change | 0.0026 |
| 2 | Today Daily Change % | 0.2900 |
| 3 | Today daily open | 0.9076 |
The pair is trading above its 20 Daily moving average @ 0.9021, above its 50 Daily moving average @ 0.8996 , below its 100 Daily moving average @ 0.9124 and below its 200 Daily moving average @ 0.9369
| Trends | Trends.1 | |
|---|---|---|
| 0 | Daily SMA20 | 0.9021 |
| 1 | Daily SMA50 | 0.8996 |
| 2 | Daily SMA100 | 0.9124 |
| 3 | Daily SMA200 | 0.9369 |
The previous day high was 0.9098 while the previous day low was 0.9034. The daily 38.2% Fib levels comes at 0.9073, expected to provide support. Similarly, the daily 61.8% fib level is at 0.9058, expected to provide support.
Note the levels of interest below:
- Pivot support is noted at 0.904, 0.9005, 0.8976
- Pivot resistance is noted at 0.9105, 0.9134, 0.917
| Levels | Levels.1 |
|---|---|
| Previous Daily High | 0.9098 |
| Previous Daily Low | 0.9034 |
| Previous Weekly High | 0.9148 |
| Previous Weekly Low | 0.9014 |
| Previous Monthly High | 0.9148 |
| Previous Monthly Low | 0.8820 |
| Daily Fibonacci 38.2% | 0.9073 |
| Daily Fibonacci 61.8% | 0.9058 |
| Daily Pivot Point S1 | 0.9040 |
| Daily Pivot Point S2 | 0.9005 |
| Daily Pivot Point S3 | 0.8976 |
| Daily Pivot Point R1 | 0.9105 |
| Daily Pivot Point R2 | 0.9134 |
| Daily Pivot Point R3 | 0.9170 |
[/s2If]
Nehcap Expert Advisor
The NEHCAP MT4 EA is high quality professional trading system geared to generate returns without using GRID or martingales. Each trade has strict risk per trade parameter. The pairs under management include EURUSD, GBPUSD, AUDCAD, AUDNZD,GBPAUD, EURAUD, EURCAD, CHFJPY and many more.
The system is trading live: LIVE ACCOUNT TRACKING
You can run it free. Apply for a free trial and track our account. Buy the system or use profit share mechanism to generate returns on your MT4.
Join Our Telegram Group
")


