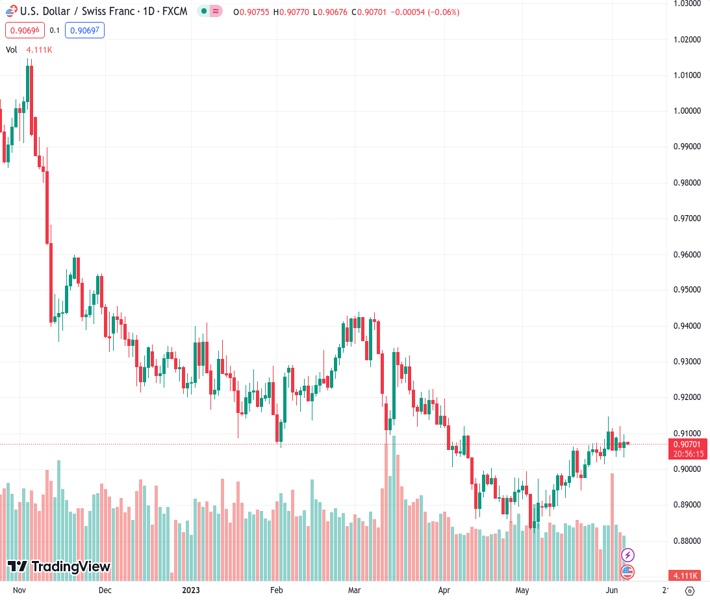
#USDCHF @ 0.90682 US Dollar strengthened against the Swiss Franc on Tuesday’s session at the 0.9075 area. (Pivot Orderbook analysis)
…
This is a premium post.
[s2If !current_user_can(access_s2member_level4)]Please register for FREE REGISTER to read full post below containing analysis. In case of any error or you think you are not able to read the full post below, please email us at support#nehcap.com [lwa][/s2If] [s2If current_user_can(access_s2member_level1)]
- US Dollar strengthened against the Swiss Franc on Tuesday’s session at the 0.9075 area.
- Focus shifts to the next US CPI reading, the Fed’s interest decision next week.
- US bond yields limited the greenback’s gains.
The pair currently trades last at 0.90682.
The previous day high was 0.912 while the previous day low was 0.9052. The daily 38.2% Fib levels comes at 0.9078, expected to provide resistance. Similarly, the daily 61.8% fib level is at 0.9094, expected to provide resistance.
The USD/CHF closed Tuesday’s session at the 0.9075 area, recording a 0.16% gain. The US dollar benefited from a cautious market mood despite US bond yields retreating ahead of next week’s CPI and interest decision from the Fed. In addition, fears of a global economic downturn amid a fresh cycle of rate hikes by the main central banks may continue to cushion the US Dollar.
According to the CME FedWatch Tool, investors are currently predicting a 73.6% chance that the Federal Reserve (Fed) will not raise interest rates at their upcoming meeting in June, instead keeping the target rate at 5.25%. However, this decision will largely depend on the forthcoming May Consumer Price Index (CPI) data. It is anticipated that the headline inflation will slow down to 4.2% (year-on-year) from the previous 4.9%, while the Core rate is expected to increase to 5.6% (year-on-year) from the previous reading of 5.5%. Consequently, the market’s expectations regarding the Fed’s decision could potentially impact the strength of the US Dollar.
Regarding the market sentiment, in Wednesday’s session, China will release key economic data which may have an impact on the prospects of a global economic downturn and hence, a weak reading may further support the greenback.
According to the daily chart, the technical outlook slightly favours the USD but indicators turned somewhat flat in positive territory. Meanwhile, the 20- and 100-day Simple Moving Averages (SMA) seem to be converging towards the 0.9100 area, hinting at a possible bullish cross by the 20-day SMA to confirm the shorter-term positive outlook.
On the upside, the mentioned level of the SMAs convergence stands as the first resistance for the bulls. Then, the following levels to watch stand at 0.9150 and 0.9180. On the downside, the 20-day SMA at 0.9030 stands as immediate support followed by the 0.9000 psychological mark and the 0.8980 area.
Technical Levels: Supports and Resistances
USDCHF currently trading at 0.9075 at the time of writing. Pair opened at 0.9062 and is trading with a change of 0.14 % .
| Overview | Overview.1 | |
|---|---|---|
| 0 | Today last price | 0.9075 |
| 1 | Today Daily Change | 0.0013 |
| 2 | Today Daily Change % | 0.1400 |
| 3 | Today daily open | 0.9062 |
The pair is trading above its 20 Daily moving average @ 0.9012, above its 50 Daily moving average @ 0.8999 , below its 100 Daily moving average @ 0.9125 and below its 200 Daily moving average @ 0.9373
| Trends | Trends.1 | |
|---|---|---|
| 0 | Daily SMA20 | 0.9012 |
| 1 | Daily SMA50 | 0.8999 |
| 2 | Daily SMA100 | 0.9125 |
| 3 | Daily SMA200 | 0.9373 |
The previous day high was 0.912 while the previous day low was 0.9052. The daily 38.2% Fib levels comes at 0.9078, expected to provide resistance. Similarly, the daily 61.8% fib level is at 0.9094, expected to provide resistance.
Note the levels of interest below:
- Pivot support is noted at 0.9037, 0.9011, 0.897
- Pivot resistance is noted at 0.9104, 0.9145, 0.9171
| Levels | Levels.1 |
|---|---|
| Previous Daily High | 0.9120 |
| Previous Daily Low | 0.9052 |
| Previous Weekly High | 0.9148 |
| Previous Weekly Low | 0.9014 |
| Previous Monthly High | 0.9148 |
| Previous Monthly Low | 0.8820 |
| Daily Fibonacci 38.2% | 0.9078 |
| Daily Fibonacci 61.8% | 0.9094 |
| Daily Pivot Point S1 | 0.9037 |
| Daily Pivot Point S2 | 0.9011 |
| Daily Pivot Point S3 | 0.8970 |
| Daily Pivot Point R1 | 0.9104 |
| Daily Pivot Point R2 | 0.9145 |
| Daily Pivot Point R3 | 0.9171 |
[/s2If]
Nehcap Expert Advisor
The NEHCAP MT4 EA is high quality professional trading system geared to generate returns without using GRID or martingales. Each trade has strict risk per trade parameter. The pairs under management include EURUSD, GBPUSD, AUDCAD, AUDNZD,GBPAUD, EURAUD, EURCAD, CHFJPY and many more.
The system is trading live: LIVE ACCOUNT TRACKING
You can run it free. Apply for a free trial and track our account. Buy the system or use profit share mechanism to generate returns on your MT4.
Join Our Telegram Group
")


