#USDCAD @ 1.34039 licks its wounds at the lowest levels in a month as Loonie traders brace for BoC. (Pivot Orderbook analysis)
…
This is a premium post.
[s2If !current_user_can(access_s2member_level4)]Please register for FREE REGISTER to read full post below containing analysis. In case of any error or you think you are not able to read the full post below, please email us at support#nehcap.com [lwa][/s2If] [s2If current_user_can(access_s2member_level1)]
- USD/CAD licks its wounds at the lowest levels in a month as Loonie traders brace for BoC.
- Oil price consolidates previous day’s losses amid mostly downbeat US Dollar, surprise draw in API inventories and market’s cautious optimism.
- US Dollar lacks momentum amid light calendar, pre-Fed blackout.
- BoC is likely to keep the benchmark rates unchanged but hawkish bias can propel the Loonie price.
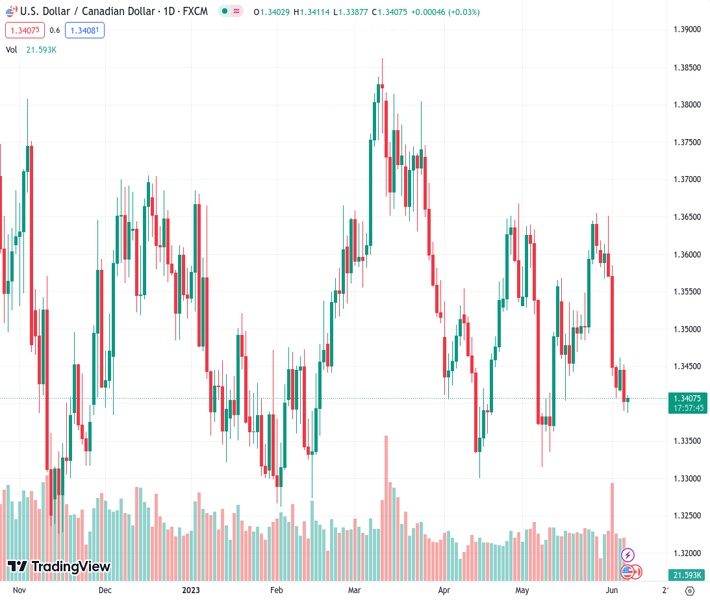
The pair currently trades last at 1.34039.
The previous day high was 1.3452 while the previous day low was 1.339. The daily 38.2% Fib levels comes at 1.3414, expected to provide resistance. Similarly, the daily 61.8% fib level is at 1.3429, expected to provide resistance.
USD/CAD picks up bids to rebound from the lowest levels in one month as it defends the 1.3400 threshold early Wednesday. In doing so, the Loonie pair prepares for the Bank of Canada (BoC) Interest Rate Decision, up for moving markets late in the day.
The Loonie pair’s latest corrective bounce could be linked to the WTI crude oil’s retreat from the intraday high, as well as the US Dollar’s pause at the daily low, amid sluggish markets.
That said, WTI crude oil remains mildly bid near $71.70 as it justifies a downbeat US Dollar and a surprise draw in the weekly Oil inventory data from the American Petroleum Institute (API). It should be noted that the global oil producers’ readiness for further output cuts joins improvement in China data to underpin the upbeat bias surrounding the black gold which is also a major export earner for Canada.
Elsewhere, US Dollar Index (DXY) reverses the previous day’s corrective bounce while taking offers around 104.00, down 0.10% on a day by the press time. In doing so, the greenback’s gauge versus six major currencies suffers from downbeat market bets on the Fed’s next move. That said, the interest rate futures show a nearly 15% probability of a June rate hike. The reason could be linked to downbeat United States activity data released on Monday, as well as the previously dovish comments from the Federal Reserve (Fed) Officials ahead of the pre-Fed blackout.
On Tuesday, Canada’s Ivey Purchasing Managers Index for May improved to 60.1 but the seasonally adjusted figures came in softer and prod the USD/CAD bears.
It should be noted that the 10-year coupons remain sluggish at around 3.67%, despite a recent corrective bounce, whereas the two-year counterpart rose a bit to 4.50% at the latest. While portraying the mood, S&P500 Futures print mild gains by tracking Wall Street’s performance.
Looking forward, Canadian statistics have been upbeat of late and hence the BoC may show readiness for further rate hikes if needed, which in turn can weigh on the USD/CAD price even if the Canadian central bank is expected to keep the rates unchanged at 4.5%.
USD/CAD sellers remain hopeful unless witnessing a clear run-up beyond the previous support line stretched from mid-April, around 1.3445 by the press time
Technical Levels: Supports and Resistances
USDCAD currently trading at 1.3403 at the time of writing. Pair opened at 1.3404 and is trading with a change of -0.01% % .
| Overview | Overview.1 | |
|---|---|---|
| 0 | Today last price | 1.3403 |
| 1 | Today Daily Change | -0.0001 |
| 2 | Today Daily Change % | -0.01% |
| 3 | Today daily open | 1.3404 |
The pair remains strongly bearish on the daily time frame. It trades below the 20 SMA @ 1.3509, 50 SMA 1.3498, 100 SMA @ 1.3518 and 200 SMA @ 1.3511.
| Trends | Trends.1 | |
|---|---|---|
| 0 | Daily SMA20 | 1.3509 |
| 1 | Daily SMA50 | 1.3498 |
| 2 | Daily SMA100 | 1.3518 |
| 3 | Daily SMA200 | 1.3511 |
The previous day high was 1.3452 while the previous day low was 1.339. The daily 38.2% Fib levels comes at 1.3414, expected to provide resistance. Similarly, the daily 61.8% fib level is at 1.3429, expected to provide resistance.
Note the levels of interest below:
- Pivot support is noted at 1.3379, 1.3353, 1.3316
- Pivot resistance is noted at 1.3441, 1.3478, 1.3503
| Levels | Levels.1 |
|---|---|
| Previous Daily High | 1.3452 |
| Previous Daily Low | 1.3390 |
| Previous Weekly High | 1.3651 |
| Previous Weekly Low | 1.3407 |
| Previous Monthly High | 1.3655 |
| Previous Monthly Low | 1.3315 |
| Daily Fibonacci 38.2% | 1.3414 |
| Daily Fibonacci 61.8% | 1.3429 |
| Daily Pivot Point S1 | 1.3379 |
| Daily Pivot Point S2 | 1.3353 |
| Daily Pivot Point S3 | 1.3316 |
| Daily Pivot Point R1 | 1.3441 |
| Daily Pivot Point R2 | 1.3478 |
| Daily Pivot Point R3 | 1.3503 |
[/s2If]
Nehcap Expert Advisor
The NEHCAP MT4 EA is high quality professional trading system geared to generate returns without using GRID or martingales. Each trade has strict risk per trade parameter. The pairs under management include EURUSD, GBPUSD, AUDCAD, AUDNZD,GBPAUD, EURAUD, EURCAD, CHFJPY and many more.
The system is trading live: LIVE ACCOUNT TRACKING
You can run it free. Apply for a free trial and track our account. Buy the system or use profit share mechanism to generate returns on your MT4.
Join Our Telegram Group
")


