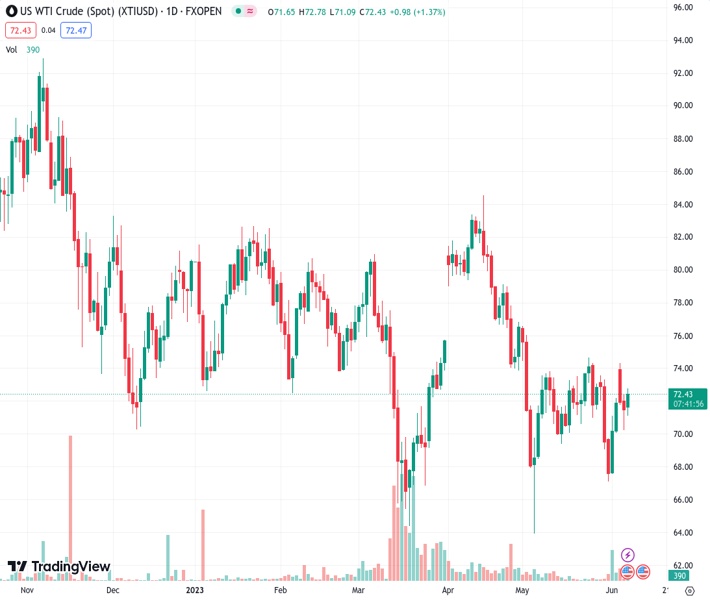
The oil price is marching towards $73.00 as hawkish Fed bets have slimmed vigorously. (Pivot Orderbook analysis)
…
This is a premium post.
[s2If !current_user_can(access_s2member_level4)]Please register for FREE REGISTER to read full post below containing analysis. In case of any error or you think you are not able to read the full post below, please email us at support#nehcap.com [lwa][/s2If] [s2If current_user_can(access_s2member_level1)]
- The oil price is marching towards $73.00 as hawkish Fed bets have slimmed vigorously.
- Weak China’s Trade Balance data failed to restrict the upside in the oil price.
- The discussions between US Blinken and Saudi Arabia’s Price, and US EIA inventory data will remain in focus.
The pair currently trades last at 72.71.
The previous day high was 72.39 while the previous day low was 70.24. The daily 38.2% Fib levels comes at 71.06, expected to provide support. Similarly, the daily 61.8% fib level is at 71.57, expected to provide support.
West Texas Intermediate (WTI), futures on NYMEX, are looking to extend their recovery towards the crucial resistance of $73.00 in the early American session. The oil price showed a solid recovery amid a sell-off in the US Dollar Index (DXY) and deepening hopes of a steady interest rate policy announcement by the Federal Reserve (Fed).
In the Asian session, oil bears were heated after the release of weak China’s Trade Balance (May) data. In US Dollar terms, Trade Balance data dropped sharply to $65.81B vs. the estimates of $92B and the former release of $90.21B. Exports were sharply contracted by 7.5% while the street was estimated a marginal contraction of 0.4%.
The likes for Chinese products are getting wane and buyers are shifting to other countries for outsourced manufacturing. It is worth noting that China is the largest importer of oil in the world and weak economic prospects in China mean a filthy demand for oil.
The US Dollar Index (DXY) has sensed selling pressure after a minor pullback move to near 104.00. Rising bets for a neutral interest rate policy by the Fed are weighing significant pressure on the USD Index. Meanwhile, the US Goods and Trade Balance deficit has grown to $74.6B, lower than the estimates of $75.2B.
Going forward, oil inventory data for the week ending June 02, reported by the United States Energy Information Administration (EIA) will be keenly watched. Apart from that, investors will keep focusing on the discussions between US Secretary of State Antony Blinken and Saudi Arabia’s Price Mohammed bin Salman Al Saud.
Technical Levels: Supports and Resistances
XTIUSD currently trading at 72.71 at the time of writing. Pair opened at 71.51 and is trading with a change of 1.68 % .
| Overview | Overview.1 | |
|---|---|---|
| 0 | Today last price | 72.71 |
| 1 | Today Daily Change | 1.20 |
| 2 | Today Daily Change % | 1.68 |
| 3 | Today daily open | 71.51 |
The pair is trading above its 20 Daily moving average @ 71.67, below its 50 Daily moving average @ 74.8 , below its 100 Daily moving average @ 75.56 and below its 200 Daily moving average @ 78.84
| Trends | Trends.1 | |
|---|---|---|
| 0 | Daily SMA20 | 71.67 |
| 1 | Daily SMA50 | 74.80 |
| 2 | Daily SMA100 | 75.56 |
| 3 | Daily SMA200 | 78.84 |
The previous day high was 72.39 while the previous day low was 70.24. The daily 38.2% Fib levels comes at 71.06, expected to provide support. Similarly, the daily 61.8% fib level is at 71.57, expected to provide support.
Note the levels of interest below:
- Pivot support is noted at 70.37, 69.23, 68.22
- Pivot resistance is noted at 72.52, 73.53, 74.68
| Levels | Levels.1 |
|---|---|
| Previous Daily High | 72.39 |
| Previous Daily Low | 70.24 |
| Previous Weekly High | 73.58 |
| Previous Weekly Low | 67.12 |
| Previous Monthly High | 76.61 |
| Previous Monthly Low | 64.31 |
| Daily Fibonacci 38.2% | 71.06 |
| Daily Fibonacci 61.8% | 71.57 |
| Daily Pivot Point S1 | 70.37 |
| Daily Pivot Point S2 | 69.23 |
| Daily Pivot Point S3 | 68.22 |
| Daily Pivot Point R1 | 72.52 |
| Daily Pivot Point R2 | 73.53 |
| Daily Pivot Point R3 | 74.68 |
[/s2If]
Nehcap Expert Advisor
The NEHCAP MT4 EA is high quality professional trading system geared to generate returns without using GRID or martingales. Each trade has strict risk per trade parameter. The pairs under management include EURUSD, GBPUSD, AUDCAD, AUDNZD,GBPAUD, EURAUD, EURCAD, CHFJPY and many more.
The system is trading live: LIVE ACCOUNT TRACKING
You can run it free. Apply for a free trial and track our account. Buy the system or use profit share mechanism to generate returns on your MT4.
Join Our Telegram Group
")


