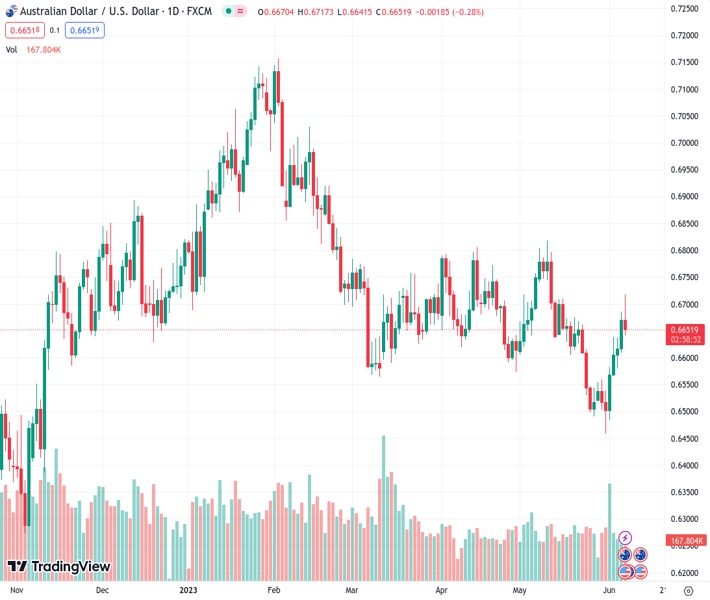
#AUDUSD @ 0.66519 AUD bulls failed to hold above the 200-SMA after the RBA rate hike momentum. (Pivot Orderbook analysis)
…
This is a premium post.
[s2If !current_user_can(access_s2member_level4)]Please register for FREE REGISTER to read full post below containing analysis. In case of any error or you think you are not able to read the full post below, please email us at support#nehcap.com [lwa][/s2If] [s2If current_user_can(access_s2member_level1)]
- AUD bulls failed to hold above the 200-SMA after the RBA rate hike momentum.
- The cautious market mood following weak Chinese data favours USD.
- Rising US bond yields gave a boost to the greenback.
The pair currently trades last at 0.66519.
The previous day high was 0.6685 while the previous day low was 0.661. The daily 38.2% Fib levels comes at 0.6656, expected to provide resistance. Similarly, the daily 61.8% fib level is at 0.6639, expected to provide support.
The AUD/USD trades with losses on Wednesday below 0.6650 area after hitting a daily high at 0.6717. A stronger US Dollar during the American session pushed the pair to the dowside. A surprising 25 basis point (bps) hike by the Bank of Canada (BoC) slightly strengthened the case for a hike by the Federal Reserve (Fed) in the upcoming June 13-14 meeting, sending US yields higher, favoring the US Dollar.
The BoC announced on Wednesday a rate hike by 25 bps while markets expected them to maintain them steady at 4.5%. In that sense, adding to the Reserve Bank of Australia’s (RBA) decision on Tuesday, the expectations of a 25 bps hike next Wednesday by the Federal Reserve (Fed) slightly increased. However, the CME FedWatch tool suggests that investors are placing higher probabilities on the Fed refraining from hiking rates and instead, keeping the target rate steady at 5.25% but the odds of a 25 bps hike jumped to 30%.
As a reaction, the US bond yields are seeing gains across the curve. The 10-year bond yield rose to 3.79% seeing a 2.35 % surge on the day, while the 2-year yield stands at 4.60% with a 2.02 % advance and the 5-year yielding 3.95% with a 2.37 % increase respectively giving additional traction to the US Dollar.
Earlier on Wednesday, the AUD/USD peaked at 0.6717, the highest level since May 11, despite weak Chinese data. The Australian Dollar was boosted by a hawkish tone from RBA Governor Lowe. However, Australian Q1 GDP data fell below expectations, with a quarterly expansion of 0.2% compared to the market consensus of 0.3%.
Technically speaking, the AUD/USD holds a neutral to bullish outlook for the short term as the bulls are struggling to maintain their dominance, but technical indicators are still favourable, suggesting that the market may still have some upside potential.
In case the Aussie recovers momentum, the following resistance line up at the 200-day Simple Moving Average (SMA) at 0.6690, followed then by the daily high at 0.6715/20 and the 100-day SMA at 0.6743. On the downside, the next support levels to watch are 0.6640, followed by 0.6605/10 and 0.6575 (weekly low).
Technical Levels: Supports and Resistances
AUDUSD currently trading at 0.6644 at the time of writing. Pair opened at 0.6672 and is trading with a change of -0.42 % .
| Overview | Overview.1 | |
|---|---|---|
| 0 | Today last price | 0.6644 |
| 1 | Today Daily Change | -0.0028 |
| 2 | Today Daily Change % | -0.4200 |
| 3 | Today daily open | 0.6672 |
The pair is trading above its 20 Daily moving average @ 0.6613, below its 50 Daily moving average @ 0.6662 , below its 100 Daily moving average @ 0.6748 and below its 200 Daily moving average @ 0.6692
| Trends | Trends.1 | |
|---|---|---|
| 0 | Daily SMA20 | 0.6613 |
| 1 | Daily SMA50 | 0.6662 |
| 2 | Daily SMA100 | 0.6748 |
| 3 | Daily SMA200 | 0.6692 |
The previous day high was 0.6685 while the previous day low was 0.661. The daily 38.2% Fib levels comes at 0.6656, expected to provide resistance. Similarly, the daily 61.8% fib level is at 0.6639, expected to provide support.
Note the levels of interest below:
- Pivot support is noted at 0.6626, 0.658, 0.655
- Pivot resistance is noted at 0.6702, 0.6731, 0.6777
| Levels | Levels.1 |
|---|---|
| Previous Daily High | 0.6685 |
| Previous Daily Low | 0.6610 |
| Previous Weekly High | 0.6639 |
| Previous Weekly Low | 0.6458 |
| Previous Monthly High | 0.6818 |
| Previous Monthly Low | 0.6458 |
| Daily Fibonacci 38.2% | 0.6656 |
| Daily Fibonacci 61.8% | 0.6639 |
| Daily Pivot Point S1 | 0.6626 |
| Daily Pivot Point S2 | 0.6580 |
| Daily Pivot Point S3 | 0.6550 |
| Daily Pivot Point R1 | 0.6702 |
| Daily Pivot Point R2 | 0.6731 |
| Daily Pivot Point R3 | 0.6777 |
[/s2If]
Nehcap Expert Advisor
The NEHCAP MT4 EA is high quality professional trading system geared to generate returns without using GRID or martingales. Each trade has strict risk per trade parameter. The pairs under management include EURUSD, GBPUSD, AUDCAD, AUDNZD,GBPAUD, EURAUD, EURCAD, CHFJPY and many more.
The system is trading live: LIVE ACCOUNT TRACKING
You can run it free. Apply for a free trial and track our account. Buy the system or use profit share mechanism to generate returns on your MT4.
Join Our Telegram Group
")


