WTI steadies below $72.00 amid jittery markets, US Dollar’s retreat amid fears of US default (Pivot Orderbook analysis)
…
This is a premium post.
[s2If !current_user_can(access_s2member_level4)]Please register for FREE REGISTER to read full post below containing analysis. In case of any error or you think you are not able to read the full post below, please email us at support#nehcap.com [lwa][/s2If] [s2If current_user_can(access_s2member_level1)]
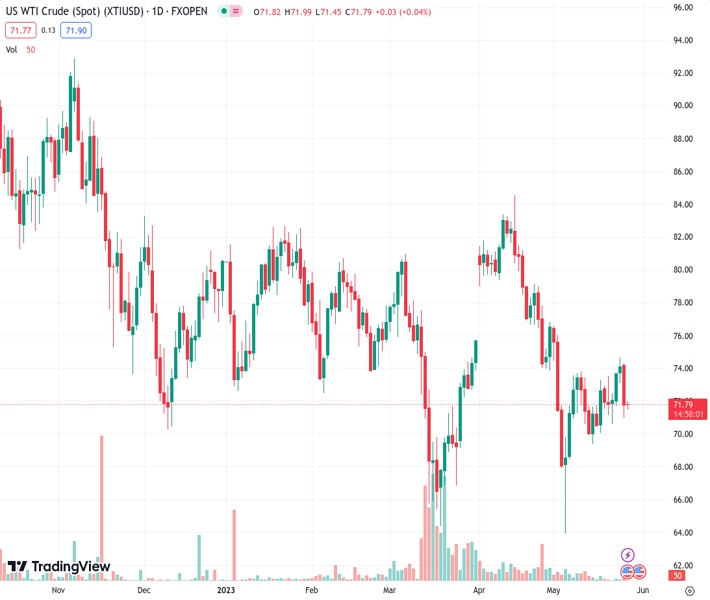
The pair currently trades last at 71.9.
The previous day high was 74.36 while the previous day low was 71.03. The daily 38.2% Fib levels comes at 72.3, expected to provide resistance. Similarly, the daily 61.8% fib level is at 73.09, expected to provide resistance.
WTI crude oil prints mild gains around $72.00 as it pares the previous day’s losses, the biggest in three weeks, heading into Friday’s European session. In doing so, the black gold struggles to justify a retreat in the US Dollar price amid mixed sentiment. Also troubling the Oil benchmark traders are mixed concerns about the demand-supply matrix of the WTI crude oil.
That said, the market sentiment dribbles as US policymakers’ inability to clinch a deal on the US debt ceiling extension contrasts with the chatters suggesting a $70.0 billion gap left to be filled by the negotiators to get the much-awaited deal. Recently, US House Speaker Kevin McCarthy announced no agreement on the debt deal, as well as the continuation of talks by saying, “It’s hard. But we’re working and we’re going to continue to work until we get this done.”
It’s worth noting that the unimpressive tone of the Federal Reserve (Fed) officials, despite upbeat US data, prods the US Dollar bulls ahead of another round of key statistics, also allowing the Oil sellers to take a breather.
Elsewhere, Russian Deputy Prime Minister Alexander Novak said on Thursday, “I do not see new steps at the June 4th OPEC+ meeting.” Russia’s Novak also added that he sees Brent above $80/bbl by year-end, $77 at the latest.
Against this backdrop, US stock futures print mild losses while the US Dollar Index retreat from a two-month high and the yields dribble near the highest levels since March. All of it portrays mixed sentiment and challenge the Oil price.
Looking ahead, the key data including the US Durable Goods Orders for April and the Core Personal Consumption Expenditure (PCE) Price Index for the said month, known as the Fed’s preferred inflation gauge, can direct intraday traders. However, major attention will be given to the next week’s OPEC+ meeting and US debt ceiling updates.
WTI crude oil grinds higher within a two-month-old rising support line and the 50-DMA, around $71.65 and $74.60 in that order.
Technical Levels: Supports and Resistances
XTIUSD currently trading at 71.9 at the time of writing. Pair opened at 71.83 and is trading with a change of 0.10% % .
| Overview | Overview.1 | |
|---|---|---|
| 0 | Today last price | 71.9 |
| 1 | Today Daily Change | 0.07 |
| 2 | Today Daily Change % | 0.10% |
| 3 | Today daily open | 71.83 |
The pair remains strongly bearish on the daily time frame. It trades below the 20 SMA @ 72.13, 50 SMA 74.51, 100 SMA @ 76.0 and 200 SMA @ 79.71.
| Trends | Trends.1 | |
|---|---|---|
| 0 | Daily SMA20 | 72.13 |
| 1 | Daily SMA50 | 74.51 |
| 2 | Daily SMA100 | 76.00 |
| 3 | Daily SMA200 | 79.71 |
The previous day high was 74.36 while the previous day low was 71.03. The daily 38.2% Fib levels comes at 72.3, expected to provide resistance. Similarly, the daily 61.8% fib level is at 73.09, expected to provide resistance.
Note the levels of interest below:
- Pivot support is noted at 70.45, 69.08, 67.12
- Pivot resistance is noted at 73.79, 75.74, 77.12
| Levels | Levels.1 |
|---|---|
| Previous Daily High | 74.36 |
| Previous Daily Low | 71.03 |
| Previous Weekly High | 73.55 |
| Previous Weekly Low | 69.39 |
| Previous Monthly High | 83.40 |
| Previous Monthly Low | 73.88 |
| Daily Fibonacci 38.2% | 72.30 |
| Daily Fibonacci 61.8% | 73.09 |
| Daily Pivot Point S1 | 70.45 |
| Daily Pivot Point S2 | 69.08 |
| Daily Pivot Point S3 | 67.12 |
| Daily Pivot Point R1 | 73.79 |
| Daily Pivot Point R2 | 75.74 |
| Daily Pivot Point R3 | 77.12 |
[/s2If]
Nehcap Expert Advisor
The NEHCAP MT4 EA is high quality professional trading system geared to generate returns without using GRID or martingales. Each trade has strict risk per trade parameter. The pairs under management include EURUSD, GBPUSD, AUDCAD, AUDNZD,GBPAUD, EURAUD, EURCAD, CHFJPY and many more.
The system is trading live: LIVE ACCOUNT TRACKING
You can run it free. Apply for a free trial and track our account. Buy the system or use profit share mechanism to generate returns on your MT4.
Join Our Telegram Group
")


