#USDZAR @ 19.7462 Price Analysis: South African Rand eases from record high within longer-term bullish channel, @nehcap view: Pullback expected (Pivot Orderbook analysis)
…
This is a premium post.
[s2If !current_user_can(access_s2member_level4)]Please register for FREE REGISTER to read full post below containing analysis. In case of any error or you think you are not able to read the full post below, please email us at support#nehcap.com [lwa][/s2If] [s2If current_user_can(access_s2member_level1)]
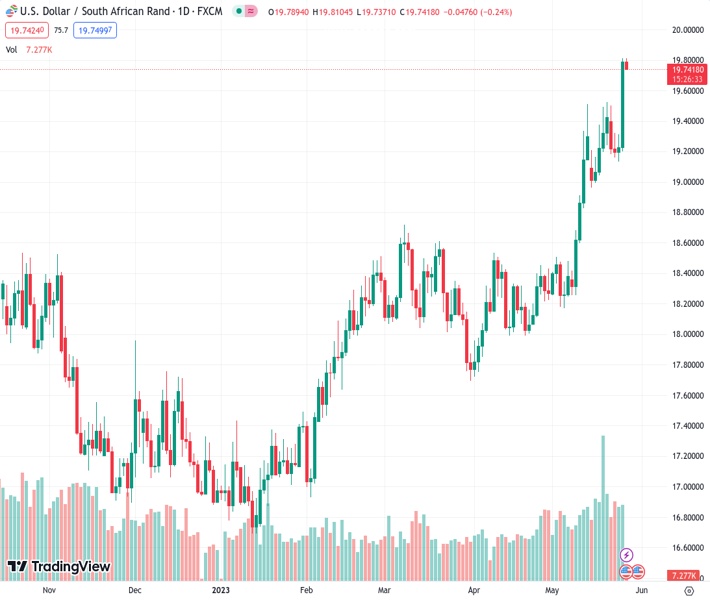
The pair currently trades last at 19.7462.
The previous day high was 19.8326 while the previous day low was 19.2395. The daily 38.2% Fib levels comes at 19.606, expected to provide support. Similarly, the daily 61.8% fib level is at 19.4661, expected to provide support.
USD/ZAR takes offers to refresh intraday low as it steps back from the all-time high marked the previous day. In doing so, the South African Rand (ZAR) pair drops 0.25% intraday to 19.75 heading into Friday’s European session.
That said, the USD/ZAR pair marked the biggest daily gains in a year the previous day as it crossed an upward-sloping resistance line from March, now immediate support near 19.70. However, the overbought RSI (14) allowed South African Rand traders to lick their wounds within a 1.5-year-old rising trend channel bullish formation.
Hence, a two-month-old resistance-turned-support line, around 19.70 restricts the immediate downside of the USD/ZAR pair ahead of highlighting the tops marked earlier in the month around 19.52 and 19.51.
In a case where the South African Rand recovers beyond 19.51, the 10-DMA and an upward-sloping trend line from October 2022, close to 19.33 and 18.80 in that order, could challenge the pair sellers.
On the flip side, the 20.00 psychological magnet lures the USD/ZAR buyers ahead of the stated channel’s top line surrounding 20.12.
Overall, the South African Rand remains on the bear’s radar despite the latest pullback.
Trend: Pullback expected
Technical Levels: Supports and Resistances
USDZAR currently trading at 19.7426 at the time of writing. Pair opened at 19.8038 and is trading with a change of -0.31% % .
| Overview | Overview.1 | |
|---|---|---|
| 0 | Today last price | 19.7426 |
| 1 | Today Daily Change | -0.0612 |
| 2 | Today Daily Change % | -0.31% |
| 3 | Today daily open | 19.8038 |
The pair remains strongly bullish on the daily timeframe. It trades above its 20 SMA @ 18.9081, 50 SMA 18.4809, 100 SMA @ 18.1023 and 200 SMA @ 17.8135.
| Trends | Trends.1 | |
|---|---|---|
| 0 | Daily SMA20 | 18.9081 |
| 1 | Daily SMA50 | 18.4809 |
| 2 | Daily SMA100 | 18.1023 |
| 3 | Daily SMA200 | 17.8135 |
The previous day high was 19.8326 while the previous day low was 19.2395. The daily 38.2% Fib levels comes at 19.606, expected to provide support. Similarly, the daily 61.8% fib level is at 19.4661, expected to provide support.
Note the levels of interest below:
- Pivot support is noted at 19.418, 19.0323, 18.825
- Pivot resistance is noted at 20.011, 20.2183, 20.604
| Levels | Levels.1 |
|---|---|
| Previous Daily High | 19.8326 |
| Previous Daily Low | 19.2395 |
| Previous Weekly High | 19.5250 |
| Previous Weekly Low | 18.9943 |
| Previous Monthly High | 18.5399 |
| Previous Monthly Low | 17.7526 |
| Daily Fibonacci 38.2% | 19.6060 |
| Daily Fibonacci 61.8% | 19.4661 |
| Daily Pivot Point S1 | 19.4180 |
| Daily Pivot Point S2 | 19.0323 |
| Daily Pivot Point S3 | 18.8250 |
| Daily Pivot Point R1 | 20.0110 |
| Daily Pivot Point R2 | 20.2183 |
| Daily Pivot Point R3 | 20.6040 |
[/s2If]
Nehcap Expert Advisor
The NEHCAP MT4 EA is high quality professional trading system geared to generate returns without using GRID or martingales. Each trade has strict risk per trade parameter. The pairs under management include EURUSD, GBPUSD, AUDCAD, AUDNZD,GBPAUD, EURAUD, EURCAD, CHFJPY and many more.
The system is trading live: LIVE ACCOUNT TRACKING
You can run it free. Apply for a free trial and track our account. Buy the system or use profit share mechanism to generate returns on your MT4.
Join Our Telegram Group
")


