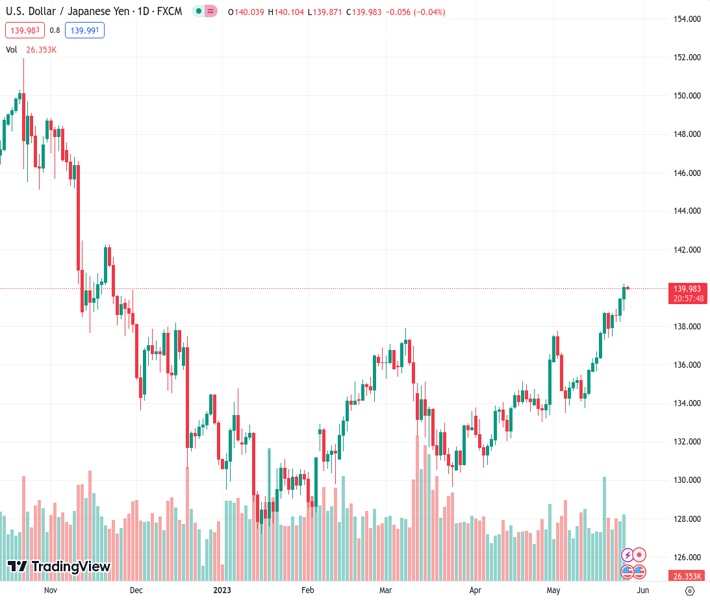
#USDJPY @ 140.015 reverses pullback from yearly top near 140.00 on mixed Tokyo inflation, upbeat yields (Pivot Orderbook analysis)
…
This is a premium post.
[s2If !current_user_can(access_s2member_level4)]Please register for FREE REGISTER to read full post below containing analysis. In case of any error or you think you are not able to read the full post below, please email us at support#nehcap.com [lwa][/s2If] [s2If current_user_can(access_s2member_level1)]
The pair currently trades last at 140.015.
The previous day high was 139.48 while the previous day low was 138.23. The daily 38.2% Fib levels comes at 139.0, expected to provide support. Similarly, the daily 61.8% fib level is at 138.71, expected to provide support.
USD/JPY pares intraday losses around the 140.00 round figure, bouncing off the daily low, as it jumps back towards the Year-To-Date (YTD) high marked the previous day. That said, the Yen pair picks up bids after Japan’s inflation gauge eased during early Friday.
Tokyo Consumer Price Index (CPI) eased to 3.2% YoY from 3.5% previous readings and 3.9% market forecasts. On the same line is the Tokyo CPI ex Fresh Food while the Tokyo CPI ex Food, Energy edged higher but stays below the market forecasts for the said month.
Given the downbeat Japanese inflation, the Bank of Japan (BoJ) policymakers’ defense of easy money policies remains valid and favors the Yen pair buyers. On Thursday, Bank of Japan (BoJ) Governor Kazuo Ueda said that they could tweak the Yield Curve Control (YCC) strategy if the balance between the benefit and the cost of the policy were to shift, as reported by Reuters.
In addition to the BoJ concerns, strong Treasury bond yields and upbeat US data also underpin the USD/JPY pair’s strength as it remains near the highest levels since November 2022. On Thursday, the second estimation of the US Annualized Gross Domestic Product (GDP) for Q1 2023 was revised up to 1.3% versus 1.0% first forecasts. Further, the Chicago Fed National Activity Index for April improved to 0.07 from -0.37 prior and -0.02 market estimations. On the same line, Kansad Fed Manufacturing Activity improved to -2 for May compared to -21 previous readings and analysts’ estimations of -11. It’s worth noting that the US Pending Home Sales for April improved on YoY but eased on MoM whereas Core Personal Consumption Expenditures also rose to 5.0% during the preliminary readings versus 4.9% prior.
It should be noted that Japan’s economic optimism and looming fears of US debt ceiling expiration are extra catalysts that define the USD/JPY pair’s current status. Japanese Cabinet Office released the monthly assessment report on Thursday and raised the overall economic view for the first time since July 2022 in May. The government report also noted that the economy is ‘recovering moderately’.
Against this backdrop, the US Dollar Index (DXY) rose to the highest levels in 10 weeks, to 104.20 at the latest, whereas the US 10-year and two-year Treasury bond yields rose to the early March highs of around 3.82% and 4.54% in that order. That said, Wall Street closed mixed but S&P500 Futures is mildly offered at the latest.
Having witnessed the initial reaction to Japan’s inflation numbers, the USD/JPY sellers may find it difficult to keep the reins amid the market’s risk-off mood and upbeat US data favoring the US Dollar, not to forget the upbeat yields. With this, the updates surrounding the US debt ceiling negotiations and a slew of the US data will be eyed for clear directions.
Despite the latest pullback, a two-week-old ascending support line and the resistance-turned-support line stretched from mid-December 2022, respectively near 139.55 and 137.70, restrict short-term downside of the USD/JPY pair.
Technical Levels: Supports and Resistances
USDJPY currently trading at 139.92 at the time of writing. Pair opened at 139.46 and is trading with a change of 0.33% % .
| Overview | Overview.1 | |
|---|---|---|
| 0 | Today last price | 139.92 |
| 1 | Today Daily Change | 0.46 |
| 2 | Today Daily Change % | 0.33% |
| 3 | Today daily open | 139.46 |
The pair remains strongly bullish on the daily timeframe. It trades above its 20 SMA @ 136.32, 50 SMA 134.18, 100 SMA @ 133.36 and 200 SMA @ 137.19.
| Trends | Trends.1 | |
|---|---|---|
| 0 | Daily SMA20 | 136.32 |
| 1 | Daily SMA50 | 134.18 |
| 2 | Daily SMA100 | 133.36 |
| 3 | Daily SMA200 | 137.19 |
The previous day high was 139.48 while the previous day low was 138.23. The daily 38.2% Fib levels comes at 139.0, expected to provide support. Similarly, the daily 61.8% fib level is at 138.71, expected to provide support.
Note the levels of interest below:
- Pivot support is noted at 138.64, 137.81, 137.39
- Pivot resistance is noted at 139.88, 140.3, 141.13
| Levels | Levels.1 |
|---|---|
| Previous Daily High | 139.48 |
| Previous Daily Low | 138.23 |
| Previous Weekly High | 138.75 |
| Previous Weekly Low | 135.65 |
| Previous Monthly High | 136.56 |
| Previous Monthly Low | 130.63 |
| Daily Fibonacci 38.2% | 139.00 |
| Daily Fibonacci 61.8% | 138.71 |
| Daily Pivot Point S1 | 138.64 |
| Daily Pivot Point S2 | 137.81 |
| Daily Pivot Point S3 | 137.39 |
| Daily Pivot Point R1 | 139.88 |
| Daily Pivot Point R2 | 140.30 |
| Daily Pivot Point R3 | 141.13 |
[/s2If]
Nehcap Expert Advisor
The NEHCAP MT4 EA is high quality professional trading system geared to generate returns without using GRID or martingales. Each trade has strict risk per trade parameter. The pairs under management include EURUSD, GBPUSD, AUDCAD, AUDNZD,GBPAUD, EURAUD, EURCAD, CHFJPY and many more.
The system is trading live: LIVE ACCOUNT TRACKING
You can run it free. Apply for a free trial and track our account. Buy the system or use profit share mechanism to generate returns on your MT4.
Join Our Telegram Group
")


