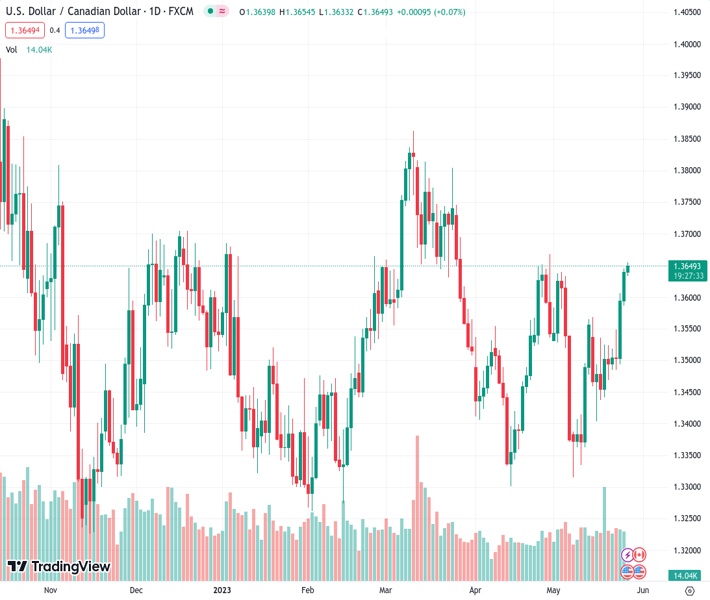
#USDCAD @ 1.36494 prods monthly top near 1.3650 amid sluggish Oil price, US Dollar retreat ahead of key data (Pivot Orderbook analysis)
…
This is a premium post.
[s2If !current_user_can(access_s2member_level4)]Please register for FREE REGISTER to read full post below containing analysis. In case of any error or you think you are not able to read the full post below, please email us at support#nehcap.com [lwa][/s2If] [s2If current_user_can(access_s2member_level1)]
The pair currently trades last at 1.36494.
The previous day high was 1.3645 while the previous day low was 1.3586. The daily 38.2% Fib levels comes at 1.3623, expected to provide support. Similarly, the daily 61.8% fib level is at 1.3609, expected to provide support.
USD/CAD bulls take a breather after refreshing the monthly high, retreating to 1.3645 during the mid-Asian session on Friday. In doing so, the Loonie pair takes clues from the latest retreat in the US Dollar price while also justifying the downbeat Oil prices and sour sentiment.
While the US Dollar’s pullback could be linked to a cautious mood ahead of the key data, fears surrounding the US default and upbeat US Q1 GDP, as well as other activity numbers, keep the Loonie pair buyers hopeful. Additionally, mixed feeling about the Oil price adds trading filters to the USD/CAD price.
That said, the US Dollar Index (DXY) retreated from the highest levels since March 13 to 104.17 by the press time as traders await the US Durable Goods Orders for April and the Core Personal Consumption Expenditure (PCE) Price Index for the said month, known as the Fed’s preferred inflation gauge.
On Thursday, the second estimation of the US Annualized Gross Domestic Product (GDP) for Q1 2023 was revised up to 1.3% versus 1.0% first forecasts. Further, the Chicago Fed National Activity Index for April improved to 0.07 from -0.37 prior and -0.02 market estimations. On the same line, Kansad Fed Manufacturing Activity improved to -2 for May compared to -21 previous readings and analysts’ estimations of -11. It’s worth noting that the US Pending Home Sales for April improved on YoY but eased on MoM whereas Core Personal Consumption Expenditures also rose to 5.0% during the preliminary readings versus 4.9% prior.
However, hawkish Fed bets and the US debt ceiling expiration concerns allow the US Dollar to dominate. Recently, US House Speaker Kevin McCarthy announced no agreement on the debt deal, as well as the continuation of talks by saying, “It’s hard. But we’re working and we’re going to continue to work until we get this done.”
On the other hand, WTI crude oil remains indecisive around $71.85 as it struggles to cheer the US Dollar’s retreat amid hopes of witnessing the $80.00 price, suggested by Russian Deputy Prime Minister Alexander Novak on Thursday.
While portraying the mood, S&P500 Futures print mild losses while the Yields grind higher amid the market’s indecision, which in turn prod the USD/CAD bulls ahead of the key US data and looming debt payment default.
USD/CAD bulls need validation from the previous monthly high of around 1.3665-70 to keep the reins. That said, the overbought RSI conditions suggest a pullback towards the previous resistance line stretched from March, around 1.3540 at the latest.
Technical Levels: Supports and Resistances
USDCAD currently trading at 1.3651 at the time of writing. Pair opened at 1.3641 and is trading with a change of 0.07% % .
| Overview | Overview.1 | |
|---|---|---|
| 0 | Today last price | 1.3651 |
| 1 | Today Daily Change | 0.0010 |
| 2 | Today Daily Change % | 0.07% |
| 3 | Today daily open | 1.3641 |
The pair remains strongly bullish on the daily timeframe. It trades above its 20 SMA @ 1.3504, 50 SMA 1.3527, 100 SMA @ 1.351 and 200 SMA @ 1.349.
| Trends | Trends.1 | |
|---|---|---|
| 0 | Daily SMA20 | 1.3504 |
| 1 | Daily SMA50 | 1.3527 |
| 2 | Daily SMA100 | 1.3510 |
| 3 | Daily SMA200 | 1.3490 |
The previous day high was 1.3645 while the previous day low was 1.3586. The daily 38.2% Fib levels comes at 1.3623, expected to provide support. Similarly, the daily 61.8% fib level is at 1.3609, expected to provide support.
Note the levels of interest below:
- Pivot support is noted at 1.3603, 1.3566, 1.3545
- Pivot resistance is noted at 1.3662, 1.3682, 1.372
| Levels | Levels.1 |
|---|---|
| Previous Daily High | 1.3645 |
| Previous Daily Low | 1.3586 |
| Previous Weekly High | 1.3568 |
| Previous Weekly Low | 1.3404 |
| Previous Monthly High | 1.3668 |
| Previous Monthly Low | 1.3301 |
| Daily Fibonacci 38.2% | 1.3623 |
| Daily Fibonacci 61.8% | 1.3609 |
| Daily Pivot Point S1 | 1.3603 |
| Daily Pivot Point S2 | 1.3566 |
| Daily Pivot Point S3 | 1.3545 |
| Daily Pivot Point R1 | 1.3662 |
| Daily Pivot Point R2 | 1.3682 |
| Daily Pivot Point R3 | 1.3720 |
[/s2If]
Nehcap Expert Advisor
The NEHCAP MT4 EA is high quality professional trading system geared to generate returns without using GRID or martingales. Each trade has strict risk per trade parameter. The pairs under management include EURUSD, GBPUSD, AUDCAD, AUDNZD,GBPAUD, EURAUD, EURCAD, CHFJPY and many more.
The system is trading live: LIVE ACCOUNT TRACKING
You can run it free. Apply for a free trial and track our account. Buy the system or use profit share mechanism to generate returns on your MT4.
Join Our Telegram Group
")


