#GBPUSD @ 1.23270 Price Analysis: Bears attack adjacent support near 1.2300, UK Retail Sales eyed, @nehcap view: Limited downside expected (Pivot Orderbook analysis)
…
This is a premium post.
[s2If !current_user_can(access_s2member_level4)]Please register for FREE REGISTER to read full post below containing analysis. In case of any error or you think you are not able to read the full post below, please email us at support#nehcap.com [lwa][/s2If] [s2If current_user_can(access_s2member_level1)]
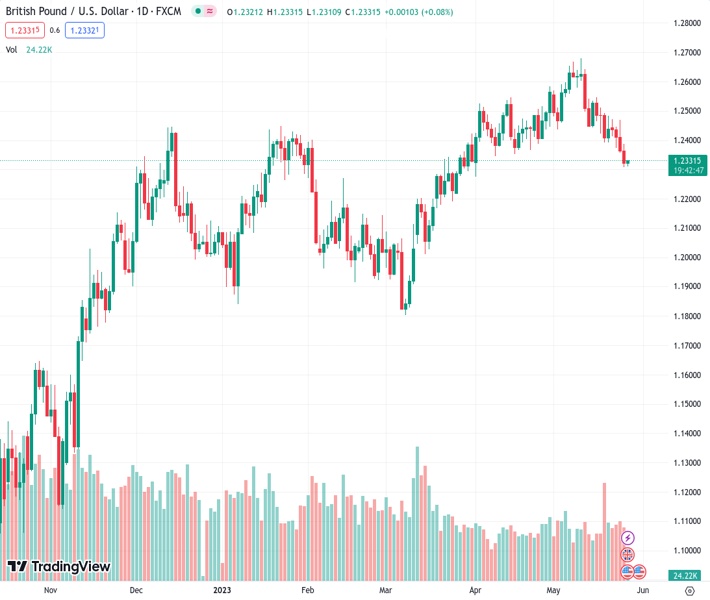
The pair currently trades last at 1.23270.
The previous day high was 1.2387 while the previous day low was 1.2308. The daily 38.2% Fib levels comes at 1.2338, expected to provide resistance. Similarly, the daily 61.8% fib level is at 1.2357, expected to provide resistance.
GBP/USD remains on the back foot at a two-month bottom as sellers prod a short-term support line ahead of the key UK Retail Sales data on early Friday. In doing so, the Pound Sterling struggles to extend the three-day losing streak around 1.2320-15 by the press time.
That said, the UK Retail Sales for April, expected 0.3% MoM versus -0.9% prior, can join the aforementioned two-week-old support line and nearly oversold RSI (14) line to challenge the Cable pair sellers.
However, a downward-sloping resistance line from May 10, close to 1.2370 at the latest, could challenge the GBP/USD pair’s further recovery.
Even if the Cable pair remains firmer past 1.2370, the 50-DMA hurdle of around 1.2435 may act as the last defense of the bears before giving control to the bulls.
On the flip side, a clear break of the immediate support line near 1.2300 could aim for the 100-DMA support of 1.2285.
Following that, a horizontal area comprising levels marked since March 13 and the 61.8% Fibonacci retracement of its March-May upside, respectively around 1.2190-85 and 1.2140 in that order, could challenge the GBP/USD bears.
Trend: Limited downside expected
Technical Levels: Supports and Resistances
GBPUSD currently trading at 1.2323 at the time of writing. Pair opened at 1.2321 and is trading with a change of 0.02% % .
| Overview | Overview.1 | |
|---|---|---|
| 0 | Today last price | 1.2323 |
| 1 | Today Daily Change | 0.0002 |
| 2 | Today Daily Change % | 0.02% |
| 3 | Today daily open | 1.2321 |
The pair is trading below its 20 Daily moving average @ 1.2501, below its 50 Daily moving average @ 1.2432 , above its 100 Daily moving average @ 1.2285 and above its 200 Daily moving average @ 1.1976
| Trends | Trends.1 | |
|---|---|---|
| 0 | Daily SMA20 | 1.2501 |
| 1 | Daily SMA50 | 1.2432 |
| 2 | Daily SMA100 | 1.2285 |
| 3 | Daily SMA200 | 1.1976 |
The previous day high was 1.2387 while the previous day low was 1.2308. The daily 38.2% Fib levels comes at 1.2338, expected to provide resistance. Similarly, the daily 61.8% fib level is at 1.2357, expected to provide resistance.
Note the levels of interest below:
- Pivot support is noted at 1.229, 1.226, 1.2211
- Pivot resistance is noted at 1.237, 1.2418, 1.2449
| Levels | Levels.1 |
|---|---|
| Previous Daily High | 1.2387 |
| Previous Daily Low | 1.2308 |
| Previous Weekly High | 1.2547 |
| Previous Weekly Low | 1.2392 |
| Previous Monthly High | 1.2584 |
| Previous Monthly Low | 1.2275 |
| Daily Fibonacci 38.2% | 1.2338 |
| Daily Fibonacci 61.8% | 1.2357 |
| Daily Pivot Point S1 | 1.2290 |
| Daily Pivot Point S2 | 1.2260 |
| Daily Pivot Point S3 | 1.2211 |
| Daily Pivot Point R1 | 1.2370 |
| Daily Pivot Point R2 | 1.2418 |
| Daily Pivot Point R3 | 1.2449 |
[/s2If]
Nehcap Expert Advisor
The NEHCAP MT4 EA is high quality professional trading system geared to generate returns without using GRID or martingales. Each trade has strict risk per trade parameter. The pairs under management include EURUSD, GBPUSD, AUDCAD, AUDNZD,GBPAUD, EURAUD, EURCAD, CHFJPY and many more.
The system is trading live: LIVE ACCOUNT TRACKING
You can run it free. Apply for a free trial and track our account. Buy the system or use profit share mechanism to generate returns on your MT4.
Join Our Telegram Group
")


