#EURUSD @ 1.07356 Price Analysis: Euro rebounds to target 1.0750 amid persistent bears ahead of key US data, @nehcap view: Bearish (Pivot Orderbook analysis)
…
This is a premium post.
[s2If !current_user_can(access_s2member_level4)]Please register for FREE REGISTER to read full post below containing analysis. In case of any error or you think you are not able to read the full post below, please email us at support#nehcap.com [lwa][/s2If] [s2If current_user_can(access_s2member_level1)]
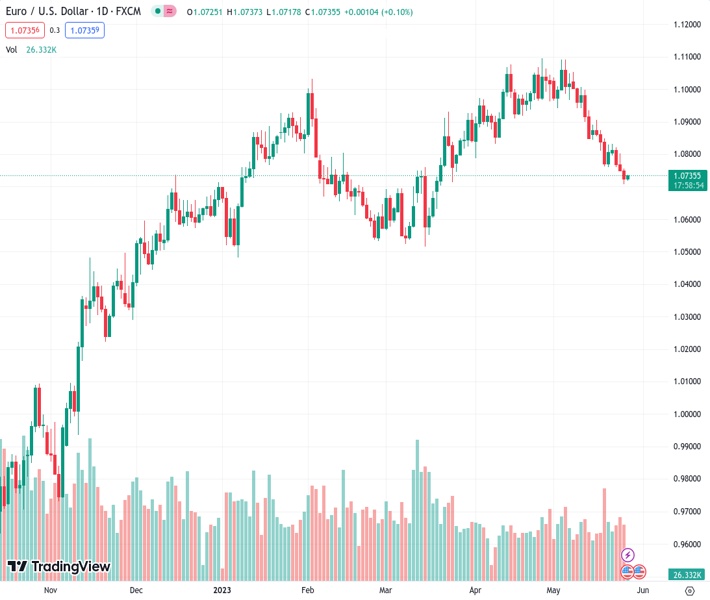
The pair currently trades last at 1.07356.
The previous day high was 1.0757 while the previous day low was 1.0708. The daily 38.2% Fib levels comes at 1.0726, expected to provide support. Similarly, the daily 61.8% fib level is at 1.0738, expected to provide resistance.
EUR/USD consolidated weekly losses at the lowest levels since late March, mildly bid near 1.0735 during early Friday morning in Europe.
In doing so, the major currency pair prints the first daily gains in four while bouncing off a six-month-long rising trend line.
That said, the recently oversold RSI (14) line adds strength to the EUR/USD pair’s corrective bounce. However, bearish MACD signals and a downward-sloping resistance line from early May, close to 1.0765 at the latest, challenge the Euro pair buyers.
Even if the EUR/USD buyers manage to cross the 1.0765 hurdle, the 100-day Exponential Moving Average (EMA) of around 1.0780 can act as the last defense of the EUR/USD bears before directing it to the mid-month peak surrounding 1.0900.
It should be noted that the EUR/USD remains bearish unless crossing the 1.1000 psychological magnet.
On the flip side, the aforementioned support line and the 200-day EMA, respectively near 1.0710 and 1.0685, restrict the short-term EUR/USD downside.
Following that a slump towards the yearly low marked in March around 1.0515 can’t be ruled out.
Overall, EUR/USD remains on the bear’s radar despite the latest corrective bounce.
Trend: Bearish
Technical Levels: Supports and Resistances
EURUSD currently trading at 1.0735 at the time of writing. Pair opened at 1.0725 and is trading with a change of 0.09% % .
| Overview | Overview.1 | |
|---|---|---|
| 0 | Today last price | 1.0735 |
| 1 | Today Daily Change | 0.0010 |
| 2 | Today Daily Change % | 0.09% |
| 3 | Today daily open | 1.0725 |
The pair is trading below its 20 Daily moving average @ 1.0901, below its 50 Daily moving average @ 1.0903 , below its 100 Daily moving average @ 1.0815 and above its 200 Daily moving average @ 1.0479
| Trends | Trends.1 | |
|---|---|---|
| 0 | Daily SMA20 | 1.0901 |
| 1 | Daily SMA50 | 1.0903 |
| 2 | Daily SMA100 | 1.0815 |
| 3 | Daily SMA200 | 1.0479 |
The previous day high was 1.0757 while the previous day low was 1.0708. The daily 38.2% Fib levels comes at 1.0726, expected to provide support. Similarly, the daily 61.8% fib level is at 1.0738, expected to provide resistance.
Note the levels of interest below:
- Pivot support is noted at 1.0703, 1.0681, 1.0654
- Pivot resistance is noted at 1.0752, 1.0779, 1.0801
| Levels | Levels.1 |
|---|---|
| Previous Daily High | 1.0757 |
| Previous Daily Low | 1.0708 |
| Previous Weekly High | 1.0904 |
| Previous Weekly Low | 1.0760 |
| Previous Monthly High | 1.1095 |
| Previous Monthly Low | 1.0788 |
| Daily Fibonacci 38.2% | 1.0726 |
| Daily Fibonacci 61.8% | 1.0738 |
| Daily Pivot Point S1 | 1.0703 |
| Daily Pivot Point S2 | 1.0681 |
| Daily Pivot Point S3 | 1.0654 |
| Daily Pivot Point R1 | 1.0752 |
| Daily Pivot Point R2 | 1.0779 |
| Daily Pivot Point R3 | 1.0801 |
[/s2If]
Nehcap Expert Advisor
The NEHCAP MT4 EA is high quality professional trading system geared to generate returns without using GRID or martingales. Each trade has strict risk per trade parameter. The pairs under management include EURUSD, GBPUSD, AUDCAD, AUDNZD,GBPAUD, EURAUD, EURCAD, CHFJPY and many more.
The system is trading live: LIVE ACCOUNT TRACKING
You can run it free. Apply for a free trial and track our account. Buy the system or use profit share mechanism to generate returns on your MT4.
Join Our Telegram Group
")


