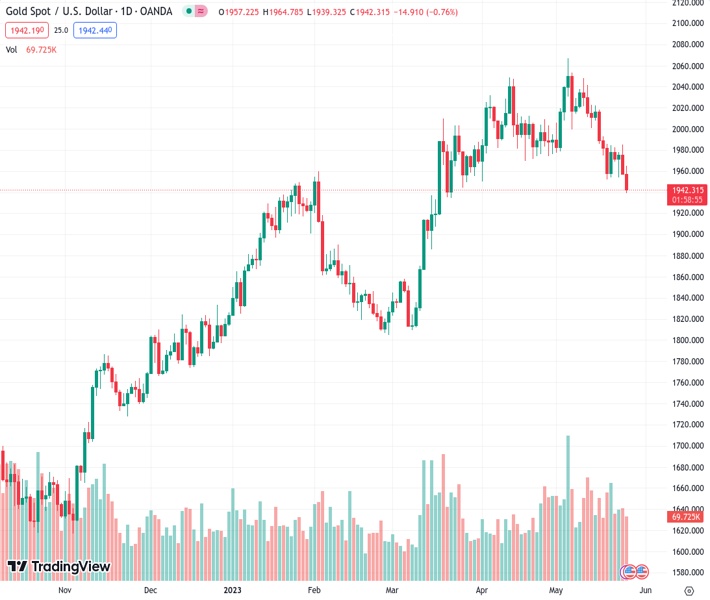
#XAUUSD @ 1,942.39 falls to $1,940.00, during the American session. (Pivot Orderbook analysis)
…
This is a premium post.
[s2If !current_user_can(access_s2member_level4)]Please register for FREE REGISTER to read full post below containing analysis. In case of any error or you think you are not able to read the full post below, please email us at support#nehcap.com [lwa][/s2If] [s2If current_user_can(access_s2member_level1)]
- XAU/USD falls to $1,940.00, during the American session.
- US GDP is revised up to 1.3% in the first quarter of the year (Q1), while Jobless Claims come in below expectations.
- Core PCE inflation rises by 5% in Q1.
The pair currently trades last at 1942.39.
The previous day high was 1985.3 while the previous day low was 1956.79. The daily 38.2% Fib levels comes at 1967.68, expected to provide resistance. Similarly, the daily 61.8% fib level is at 1974.41, expected to provide resistance.
The XAU/USD drops to its lowest level since March 22 due to strong economic data and a high Personal Consumption Expenditures (PCE) inflation. This leads investors to place higher bets on a 25 basis points interest rate hike by the Federal Reserve (Fed) in the upcoming June meeting. Consequently, US bond yields increase, exerting pressure on Gold prices and favoring the US Dollar.
The Gold price, as of the time of writing, is trading at $1,943.62, which is 0.7% below its opening price. Meanwhile, the US Dollar Index (DXY) Index is currently at the 104.22 level, showing a gain of 0.32% today.
The US Bureau of Economic Analysis has reported that the Gross Domestic Product (GDP) of the United States expanded by 1.3% quarter-on-quarter in the first quarter of 2023, surpassing the preliminary estimate of 1.1% which was expected to remain unchanged. In contrast, Jobless Claims for the week ending on May 19 came in at 229k, lower than the consensus of 245k. Additionally, Core PCE inflation increased to 5% quarter-on-quarter in Q1, exceeding the expected rate of 4.9%.
After the Federal Open Market Committee (FOMC) expressed concerns about economic activity, positive US data has led investors to believe that there may be more room for another interest rate hike in the upcoming decision in June. As a result, the CME FedWatch Tool now places a 49.3% probability of a 25 basis points hike, compared to yesterday’s odds of around 36%.
As a reaction, US bond yields are experiencing gains across the curve. The 10-year bond yield rose to 3.79%, marking a 3.22% increase on the day. Similarly, the 2-year yield stands at 4.46%, showing a gain of 2.61%, while the 5-year yield is at 3.87%, reflecting a gain of 3.22%. These increases in bond yields are further pressuring the price of Gold.
According to the daily chart, Gold has a bearish outlook for the short term, as indicated by the Relative Strength Index (RSI) and Moving Average Convergence Divergence (MACD), both of which are pointing down in line with price and suggesting that sellers have control.
Immediate support for Gold is observed at the $1,940.00 level, followed by the 100-day Simple Moving Average at $1,930.00 and the $1,920.00 zone. Moreover, if the precious metal gains momentum, the following resistance levels are seen at the psychological mark of $1,950.00, followed by the $1,970 zone and the 20-day Simple Moving Average at $2,000.00.
Technical Levels: Supports and Resistances
XAUUSD currently trading at 1944.18 at the time of writing. Pair opened at 1957.11 and is trading with a change of -0.66 % .
| Overview | Overview.1 | |
|---|---|---|
| 0 | Today last price | 1944.18 |
| 1 | Today Daily Change | -12.93 |
| 2 | Today Daily Change % | -0.66 |
| 3 | Today daily open | 1957.11 |
The pair is trading below its 20 Daily moving average @ 2001.08, below its 50 Daily moving average @ 1992.02 , above its 100 Daily moving average @ 1933.1 and above its 200 Daily moving average @ 1828.59
| Trends | Trends.1 | |
|---|---|---|
| 0 | Daily SMA20 | 2001.08 |
| 1 | Daily SMA50 | 1992.02 |
| 2 | Daily SMA100 | 1933.10 |
| 3 | Daily SMA200 | 1828.59 |
The previous day high was 1985.3 while the previous day low was 1956.79. The daily 38.2% Fib levels comes at 1967.68, expected to provide resistance. Similarly, the daily 61.8% fib level is at 1974.41, expected to provide resistance.
Note the levels of interest below:
- Pivot support is noted at 1947.5, 1937.89, 1918.99
- Pivot resistance is noted at 1976.01, 1994.91, 2004.52
| Levels | Levels.1 |
|---|---|
| Previous Daily High | 1985.30 |
| Previous Daily Low | 1956.79 |
| Previous Weekly High | 2022.18 |
| Previous Weekly Low | 1952.01 |
| Previous Monthly High | 2048.75 |
| Previous Monthly Low | 1949.83 |
| Daily Fibonacci 38.2% | 1967.68 |
| Daily Fibonacci 61.8% | 1974.41 |
| Daily Pivot Point S1 | 1947.50 |
| Daily Pivot Point S2 | 1937.89 |
| Daily Pivot Point S3 | 1918.99 |
| Daily Pivot Point R1 | 1976.01 |
| Daily Pivot Point R2 | 1994.91 |
| Daily Pivot Point R3 | 2004.52 |
[/s2If]
Nehcap Expert Advisor
The NEHCAP MT4 EA is high quality professional trading system geared to generate returns without using GRID or martingales. Each trade has strict risk per trade parameter. The pairs under management include EURUSD, GBPUSD, AUDCAD, AUDNZD,GBPAUD, EURAUD, EURCAD, CHFJPY and many more.
The system is trading live: LIVE ACCOUNT TRACKING
You can run it free. Apply for a free trial and track our account. Buy the system or use profit share mechanism to generate returns on your MT4.
Join Our Telegram Group
")


