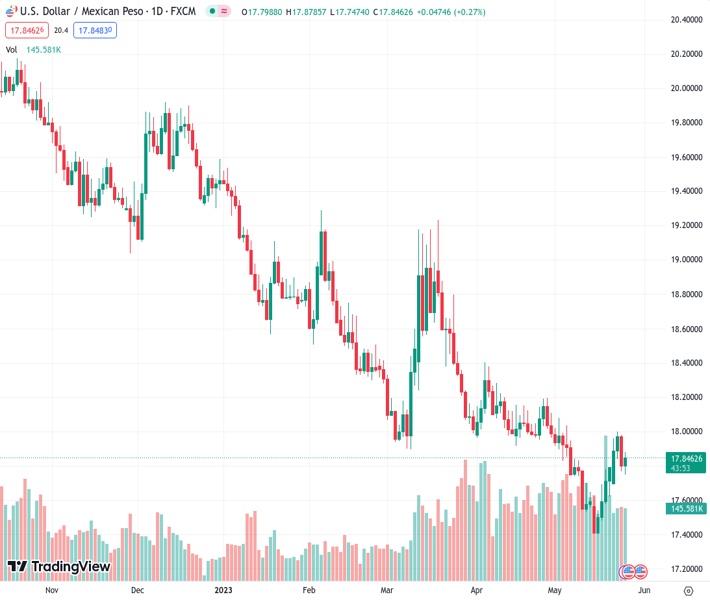
#USDMXN @ 17.8393 rebounds to around 17.8040 after a more than 2000-pip dip. (Pivot Orderbook analysis)
…
This is a premium post.
[s2If !current_user_can(access_s2member_level4)]Please register for FREE REGISTER to read full post below containing analysis. In case of any error or you think you are not able to read the full post below, please email us at support#nehcap.com [lwa][/s2If] [s2If current_user_can(access_s2member_level1)]
- USD/MXN rebounds to around 17.8040 after a more than 2000-pip dip.
- Robust US labor market data and Q1 growth revision boost the USD/MXN from 17.7000 to a daily high of 17.8785.
- Upcoming data: Mexico’s Q1 GDP, US Durable Good Orders, and Consumer Sentiment reports are set to sway the USD/MXN exchange rate.
The pair currently trades last at 17.8393.
The previous day high was 17.9817 while the previous day low was 17.7666. The daily 38.2% Fib levels comes at 17.8488, expected to provide resistance. Similarly, the daily 61.8% fib level is at 17.8995, expected to provide resistance.
USD/MXN stages recovery after diving more than 2000 pips, below the 20-day Exponential Moving Avera(EMA), which, acting as a solid support price level, capped the USD/MXN pair losses amidst a risk-off impulse. US political developments about raising the debt ceiling, and upbeat economic data amidst political uncertainty in Mexico, were the main drivers of USD/MXN price action. At the time of writing, the USD/MXN climbs and trades at around 17.8040.
Discussion in Washington shows signs of moving forwards, according to US President Joe Biden, while Kevin McCarthy, the US House Speakers added that not “everybody is going to be happy at the end of the day” regarding making some concessions as Democrats and Republicans try to agree on a deal.
Aside from hits, the economy of the United States continues to grow, as shown by solid labor market data and a revision of growth figures for Q1 2023. Initial Jobless Claims for the week ending on May 20 rose by 229K less than the 245K expected by analysts, while the Q1 Gross Domestic Product (GDP) on its second estimate jumped to 1.3%, from 1.1% in the advanced and estimated data.
Once the US data crossed the wires, the USD/MXN increased from around the daily low of 17.7000 to the daily high of 17.8785. Notably, the US Dollar Index (DXY), a gauge that measures the buck’s value against a basket of six currencies, is trading nearby two-month highs reached during the day at 104.312, putting some ground between the 200-day EMA at 103.748 and the current price.
Across the border, the Mexican economic agenda revealed the Trade Balance of Mexico, which printed a deficit of $2,965 billion in April when adjusted for seasonal swings, INEGI reported.
During the week, the USD/MXN traded with gains of 0.30% after achieving two successive weeks of losses, dragging the pair to multi-year new lows at around 17.4238. However, the USD/MXN has been recovering more than 2.50% since the last week, as the USD/MXN pair is approaching the psychological 18.0000 figure.
The Mexican economic agenda will feature final readings for Q1 Gross Domestic Product (GDP), expected at 1% in QoQ readings, while compared to the last year, the Mexican economy is estimated to grow by 3.9%. Worse than predicted figures, the Bank of Mexico (Banxico) pausing rates could trigger flows toward the safe-haven US Dollar, sending the USD/MXN pair toward the 18.00 handle. On the US front, Durable Good Orders, Consumer Sentiment, and the University of Michigan Consumer Sentiment are expected to rock the boat in the USD/MXN exchange rate.
Technical Levels: Supports and Resistances
USDMXN currently trading at 17.8407 at the time of writing. Pair opened at 17.8002 and is trading with a change of 0.23 % .
| Overview | Overview.1 | |
|---|---|---|
| 0 | Today last price | 17.8407 |
| 1 | Today Daily Change | 0.0405 |
| 2 | Today Daily Change % | 0.2300 |
| 3 | Today daily open | 17.8002 |
The pair is trading above its 20 Daily moving average @ 17.7782, below its 50 Daily moving average @ 18.0536 , below its 100 Daily moving average @ 18.3522 and below its 200 Daily moving average @ 19.0691
| Trends | Trends.1 | |
|---|---|---|
| 0 | Daily SMA20 | 17.7782 |
| 1 | Daily SMA50 | 18.0536 |
| 2 | Daily SMA100 | 18.3522 |
| 3 | Daily SMA200 | 19.0691 |
The previous day high was 17.9817 while the previous day low was 17.7666. The daily 38.2% Fib levels comes at 17.8488, expected to provide resistance. Similarly, the daily 61.8% fib level is at 17.8995, expected to provide resistance.
Note the levels of interest below:
- Pivot support is noted at 17.7174, 17.6345, 17.5023
- Pivot resistance is noted at 17.9324, 18.0646, 18.1474
| Levels | Levels.1 |
|---|---|
| Previous Daily High | 17.9817 |
| Previous Daily Low | 17.7666 |
| Previous Weekly High | 17.7978 |
| Previous Weekly Low | 17.4203 |
| Previous Monthly High | 18.4018 |
| Previous Monthly Low | 17.9329 |
| Daily Fibonacci 38.2% | 17.8488 |
| Daily Fibonacci 61.8% | 17.8995 |
| Daily Pivot Point S1 | 17.7174 |
| Daily Pivot Point S2 | 17.6345 |
| Daily Pivot Point S3 | 17.5023 |
| Daily Pivot Point R1 | 17.9324 |
| Daily Pivot Point R2 | 18.0646 |
| Daily Pivot Point R3 | 18.1474 |
[/s2If]
Nehcap Expert Advisor
The NEHCAP MT4 EA is high quality professional trading system geared to generate returns without using GRID or martingales. Each trade has strict risk per trade parameter. The pairs under management include EURUSD, GBPUSD, AUDCAD, AUDNZD,GBPAUD, EURAUD, EURCAD, CHFJPY and many more.
The system is trading live: LIVE ACCOUNT TRACKING
You can run it free. Apply for a free trial and track our account. Buy the system or use profit share mechanism to generate returns on your MT4.
Join Our Telegram Group
")


