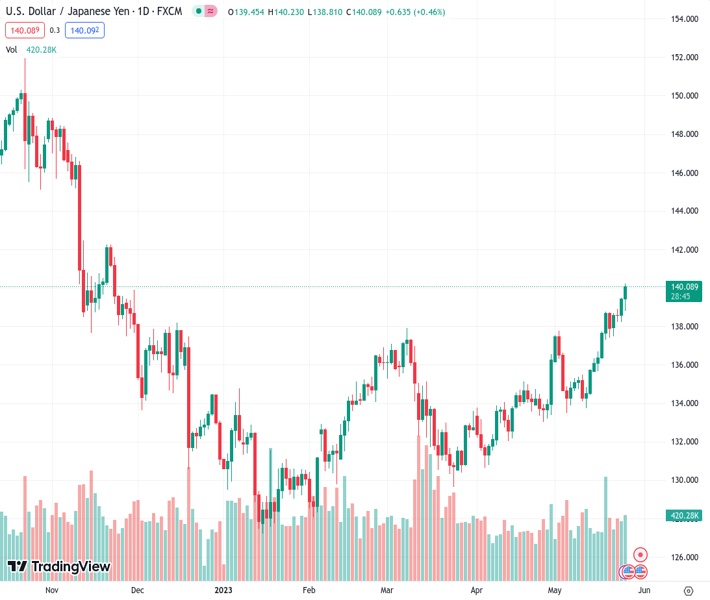
#USDJPY @ 140.093 reaches yearly highs and positions near the 140.00 level. (Pivot Orderbook analysis)
…
This is a premium post.
[s2If !current_user_can(access_s2member_level4)]Please register for FREE REGISTER to read full post below containing analysis. In case of any error or you think you are not able to read the full post below, please email us at support#nehcap.com [lwa][/s2If] [s2If current_user_can(access_s2member_level1)]
- USD/JPY reaches yearly highs and positions near the 140.00 level.
- US Q1 GDP grew by 1.3%, surpassing expectations, while Jobless Claims exceeded estimates. Core PCE inflation rose 5% in Q1.
- Investors are eagerly anticipating today’s release of the May Tokyo Consumer Price Index.
The pair currently trades last at 140.093.
The previous day high was 139.48 while the previous day low was 138.23. The daily 38.2% Fib levels comes at 139.0, expected to provide support. Similarly, the daily 61.8% fib level is at 138.71, expected to provide support.
The Ninja continue edging higher on Thursday, maintaining yearly highs and approaching the key level of 140.00. This surge comes amidst positive economic developments, with the US Q1 GDP growth surpassing expectations and Jobless Claims exceeding estimates. Additionally, core PCE inflation rose by 5% in the first quarter. In that sense, the positive economic data from the United States, coupled with the rise in US bond yields due to the increased likelihood of a Fed adjustment, further favored the US Dollar.
On the other hand, investors will closely monitor the May Tokyo Consumer Price Index, which is expected to further impact the USD/JPY pair.
The US Bureau of Economic Analysis recently announced that the United States experienced a 1.3% quarter-on-quarter expansion in Gross Domestic Product (GDP) during Q1 of 2023, surpassing the initial estimate of 1.1%. Additionally, Jobless Claims for the week ending on May 19 came in at 229k, lower than the expected consensus of 245k. Furthermore, Core PCE inflation rose to 5% in Q1, exceeding the projected rate of 4.9%.
In response to concerns expressed by the Federal Open Market Committee (FOMC) regarding economic activity, the CME FedWatch Tool now indicates a higher probability of a 25 bps interest rate increase. This development has fueled an increase in US bond yields, with the 10-year yield reaching 3.79%, reflecting a 3.22% rise in a single day. Additionally, the 2-year yield currently stands at 4.46%, representing a gain of 2.61%, while the 5-year yield sits at 3.87%, showing a 3.22% increase. These movements in bond yields provide further support to the US Dollar.
Based on the daily chart analysis, the USD/JPY exhibits a bullish outlook in the short term. The Relative Strength Index (RSI) and Moving Average Convergence Divergence (MACD) indicators indicate the dominance of buyers while the pair remains above its key moving averages.
If the USD/JPY continues to gather momentum, it is likely to encounter resistance at the 140.00 level, followed by the 140.50 zone and the psychological level of 141.00. Conversely, on the downside, important support levels to monitor include the 139.50 zone, the 139.00 level, and the weekly low at 138.50.
Technical Levels: Supports and Resistances
USDJPY currently trading at 140.1 at the time of writing. Pair opened at 139.46 and is trading with a change of 0.46 % .
| Overview | Overview.1 | |
|---|---|---|
| 0 | Today last price | 140.10 |
| 1 | Today Daily Change | 0.64 |
| 2 | Today Daily Change % | 0.46 |
| 3 | Today daily open | 139.46 |
The pair remains strongly bullish on the daily timeframe. It trades above its 20 SMA @ 136.32, 50 SMA 134.18, 100 SMA @ 133.36 and 200 SMA @ 137.19.
| Trends | Trends.1 | |
|---|---|---|
| 0 | Daily SMA20 | 136.32 |
| 1 | Daily SMA50 | 134.18 |
| 2 | Daily SMA100 | 133.36 |
| 3 | Daily SMA200 | 137.19 |
The previous day high was 139.48 while the previous day low was 138.23. The daily 38.2% Fib levels comes at 139.0, expected to provide support. Similarly, the daily 61.8% fib level is at 138.71, expected to provide support.
Note the levels of interest below:
- Pivot support is noted at 138.64, 137.81, 137.39
- Pivot resistance is noted at 139.88, 140.3, 141.13
| Levels | Levels.1 |
|---|---|
| Previous Daily High | 139.48 |
| Previous Daily Low | 138.23 |
| Previous Weekly High | 138.75 |
| Previous Weekly Low | 135.65 |
| Previous Monthly High | 136.56 |
| Previous Monthly Low | 130.63 |
| Daily Fibonacci 38.2% | 139.00 |
| Daily Fibonacci 61.8% | 138.71 |
| Daily Pivot Point S1 | 138.64 |
| Daily Pivot Point S2 | 137.81 |
| Daily Pivot Point S3 | 137.39 |
| Daily Pivot Point R1 | 139.88 |
| Daily Pivot Point R2 | 140.30 |
| Daily Pivot Point R3 | 141.13 |
[/s2If]
Nehcap Expert Advisor
The NEHCAP MT4 EA is high quality professional trading system geared to generate returns without using GRID or martingales. Each trade has strict risk per trade parameter. The pairs under management include EURUSD, GBPUSD, AUDCAD, AUDNZD,GBPAUD, EURAUD, EURCAD, CHFJPY and many more.
The system is trading live: LIVE ACCOUNT TRACKING
You can run it free. Apply for a free trial and track our account. Buy the system or use profit share mechanism to generate returns on your MT4.
Join Our Telegram Group
")


