#USDJPY @ 139.586 Price Analysis: Overbought RSI caps Yen pair’s upside below 140.00, @nehcap view: Limited upside expected (Pivot Orderbook analysis)
…
This is a premium post.
[s2If !current_user_can(access_s2member_level4)]Please register for FREE REGISTER to read full post below containing analysis. In case of any error or you think you are not able to read the full post below, please email us at support#nehcap.com [lwa][/s2If] [s2If current_user_can(access_s2member_level1)]
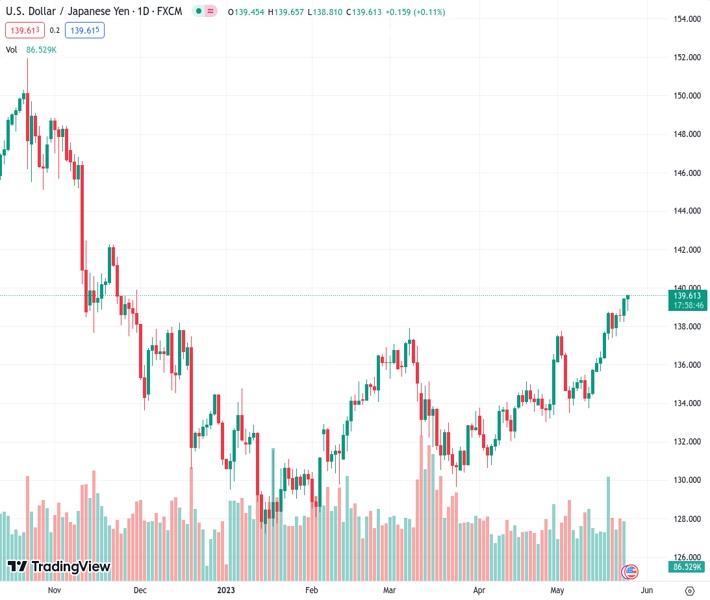
The pair currently trades last at 139.586.
The previous day high was 139.48 while the previous day low was 138.23. The daily 38.2% Fib levels comes at 139.0, expected to provide support. Similarly, the daily 61.8% fib level is at 138.71, expected to provide support.
USD/JPY edges higher as it renews the yearly top around 139.65-70 during early Thursday. In doing so, the Yen pair prods the 50% Fibonacci retracement level of its October 2022 to January 2023 downside amid overbought conditions of the RSI (14) line.
Apart from the 50% Fibonacci retracement level surrounding 139.60, the late November 2022 peak of around 139.90, quickly followed by the 140.00 round figure, also challenge the USD/JPY bulls.
In a case where the USD/JPY pair remains firmer past 140.00, the quote’s run-up towards the late November swing high of around 142.25 can’t be ruled out.
Though, the 61.8% Fibonacci retracement level near 142.50, also known as the golden Fibonacci ratio, could challenge the Yen pair buyers afterward.
Meanwhile, USD/JPY pair’s retreat remains elusive unless it breaks the previous resistance line stretched from December 2022, close to 137.80 at the latest.
Following that, the 200-DMA of around 137.20 can challenge the Yen pair sellers before giving them control.
Even so, a two-month-old ascending support line at 134.90 can prod the USD/JPY bears afterward.
Overall, USD/JPY remains on the bull’s radar even if the price is likely to witness a pullback.
Trend: Limited upside expected
Technical Levels: Supports and Resistances
USDJPY currently trading at 139.62 at the time of writing. Pair opened at 139.46 and is trading with a change of 0.11% % .
| Overview | Overview.1 | |
|---|---|---|
| 0 | Today last price | 139.62 |
| 1 | Today Daily Change | 0.16 |
| 2 | Today Daily Change % | 0.11% |
| 3 | Today daily open | 139.46 |
The pair remains strongly bullish on the daily timeframe. It trades above its 20 SMA @ 136.32, 50 SMA 134.18, 100 SMA @ 133.36 and 200 SMA @ 137.19.
| Trends | Trends.1 | |
|---|---|---|
| 0 | Daily SMA20 | 136.32 |
| 1 | Daily SMA50 | 134.18 |
| 2 | Daily SMA100 | 133.36 |
| 3 | Daily SMA200 | 137.19 |
The previous day high was 139.48 while the previous day low was 138.23. The daily 38.2% Fib levels comes at 139.0, expected to provide support. Similarly, the daily 61.8% fib level is at 138.71, expected to provide support.
Note the levels of interest below:
- Pivot support is noted at 138.64, 137.81, 137.39
- Pivot resistance is noted at 139.88, 140.3, 141.13
| Levels | Levels.1 |
|---|---|
| Previous Daily High | 139.48 |
| Previous Daily Low | 138.23 |
| Previous Weekly High | 138.75 |
| Previous Weekly Low | 135.65 |
| Previous Monthly High | 136.56 |
| Previous Monthly Low | 130.63 |
| Daily Fibonacci 38.2% | 139.00 |
| Daily Fibonacci 61.8% | 138.71 |
| Daily Pivot Point S1 | 138.64 |
| Daily Pivot Point S2 | 137.81 |
| Daily Pivot Point S3 | 137.39 |
| Daily Pivot Point R1 | 139.88 |
| Daily Pivot Point R2 | 140.30 |
| Daily Pivot Point R3 | 141.13 |
[/s2If]
Nehcap Expert Advisor
The NEHCAP MT4 EA is high quality professional trading system geared to generate returns without using GRID or martingales. Each trade has strict risk per trade parameter. The pairs under management include EURUSD, GBPUSD, AUDCAD, AUDNZD,GBPAUD, EURAUD, EURCAD, CHFJPY and many more.
The system is trading live: LIVE ACCOUNT TRACKING
You can run it free. Apply for a free trial and track our account. Buy the system or use profit share mechanism to generate returns on your MT4.
Join Our Telegram Group
")


