#GBPJPY @ 172.633 Tech stock advancement creates mixed investor sentiment, allowing to sustain gains. (Pivot Orderbook analysis)
…
This is a premium post.
[s2If !current_user_can(access_s2member_level4)]Please register for FREE REGISTER to read full post below containing analysis. In case of any error or you think you are not able to read the full post below, please email us at support#nehcap.com [lwa][/s2If] [s2If current_user_can(access_s2member_level1)]
- Tech stock advancement creates mixed investor sentiment, allowing GBP/JPY to sustain gains.
- GBP/JPY upward trend continues, eyeing potential reversal upon Bank of Japan’s policy shifts.
- In case of a dip below 172.00, GBP/JPY could test the two-week low of 171.19 and further the 170.00 mark.
The pair currently trades last at 172.633.
The previous day high was 172.8 while the previous day low was 171.24. The daily 38.2% Fib levels comes at 172.2, expected to provide support. Similarly, the daily 61.8% fib level is at 171.83, expected to provide support.
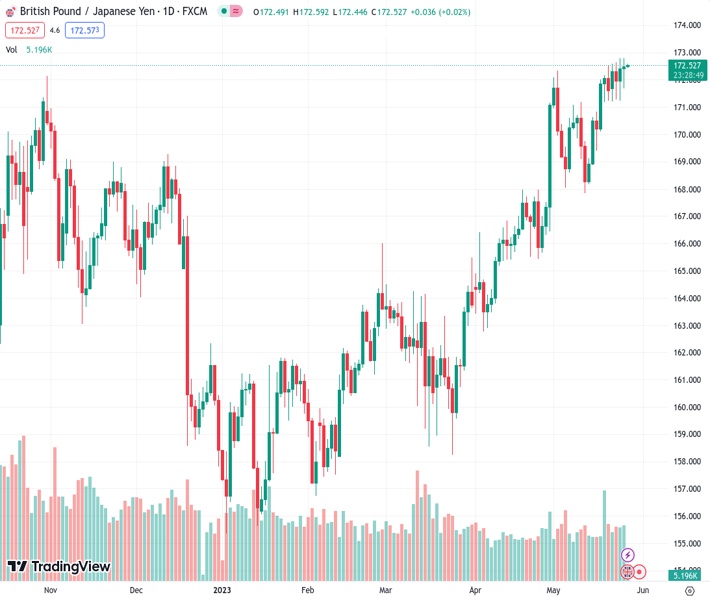
GBP/JPY edges high but fell shy of reaching a new year-to-date (YTD) high above 172.79 and remains in positive territory, albeit a mixed sentiment amongst investors, as tech stocks advance. Consequently, safe-haven peers like the Japanese Yen (JPY) retraced some of their earlier gains sustained in the Asian session. At the same time, inflation data from the United Kingdom (UK) justifies the need for further tightening, underpinning Sterling (GBP). At the time of writing, the GBP/JPY is trading at 172.46.
From a daily chart perspective, the GBP/JPY uptrend would continue before fundamental reasons change, like the Bank of Japan (BoJ) shifting its monetary policy, could open the door for a good reversal. Nevertheless, once the GBP/JPY falling wedge was broken to the upside, and Cable regained momentum above the May 2 high of 172.33, that opened the door for further gains. Since then, the GBP/JPY consolidated at 171.20-172.79 as buyers prepared to launch an assault and hit the falling-wedge measured target at 174.30.
Hence, the GBP/JPY path of least resistance is upwards. The first line of defense for GBP/JPY sellers would be the YTD high of 172.79, which is broken; the pair will move upwards and test 173.00. A breach of the latter will expose the 174.00 figure, ahead of the falling-wedge objective at 174.30.
On the flip side, if GBP/JPY slips below 172.00, that could pave the way to test the latest two-week low of 171.19 before testing the 170.00 mark. If GBP/JPY dives below that level, the 20-day Exponential Moving Average (EMA) could cap the downfall at around 170.65.
Technical Levels: Supports and Resistances
GBPJPY currently trading at 172.58 at the time of writing. Pair opened at 172.46 and is trading with a change of 0.07 % .
| Overview | Overview.1 | |
|---|---|---|
| 0 | Today last price | 172.58 |
| 1 | Today Daily Change | 0.12 |
| 2 | Today Daily Change % | 0.07 |
| 3 | Today daily open | 172.46 |
The pair remains strongly bullish on the daily timeframe. It trades above its 20 SMA @ 170.52, 50 SMA 166.76, 100 SMA @ 163.78 and 200 SMA @ 164.07.
| Trends | Trends.1 | |
|---|---|---|
| 0 | Daily SMA20 | 170.52 |
| 1 | Daily SMA50 | 166.76 |
| 2 | Daily SMA100 | 163.78 |
| 3 | Daily SMA200 | 164.07 |
The previous day high was 172.8 while the previous day low was 171.24. The daily 38.2% Fib levels comes at 172.2, expected to provide support. Similarly, the daily 61.8% fib level is at 171.83, expected to provide support.
Note the levels of interest below:
- Pivot support is noted at 171.53, 170.6, 169.97
- Pivot resistance is noted at 173.09, 173.72, 174.65
| Levels | Levels.1 |
|---|---|
| Previous Daily High | 172.80 |
| Previous Daily Low | 171.24 |
| Previous Weekly High | 172.51 |
| Previous Weekly Low | 168.91 |
| Previous Monthly High | 171.18 |
| Previous Monthly Low | 162.78 |
| Daily Fibonacci 38.2% | 172.20 |
| Daily Fibonacci 61.8% | 171.83 |
| Daily Pivot Point S1 | 171.53 |
| Daily Pivot Point S2 | 170.60 |
| Daily Pivot Point S3 | 169.97 |
| Daily Pivot Point R1 | 173.09 |
| Daily Pivot Point R2 | 173.72 |
| Daily Pivot Point R3 | 174.65 |
[/s2If]
Nehcap Expert Advisor
The NEHCAP MT4 EA is high quality professional trading system geared to generate returns without using GRID or martingales. Each trade has strict risk per trade parameter. The pairs under management include EURUSD, GBPUSD, AUDCAD, AUDNZD,GBPAUD, EURAUD, EURCAD, CHFJPY and many more.
The system is trading live: LIVE ACCOUNT TRACKING
You can run it free. Apply for a free trial and track our account. Buy the system or use profit share mechanism to generate returns on your MT4.
Join Our Telegram Group
")


