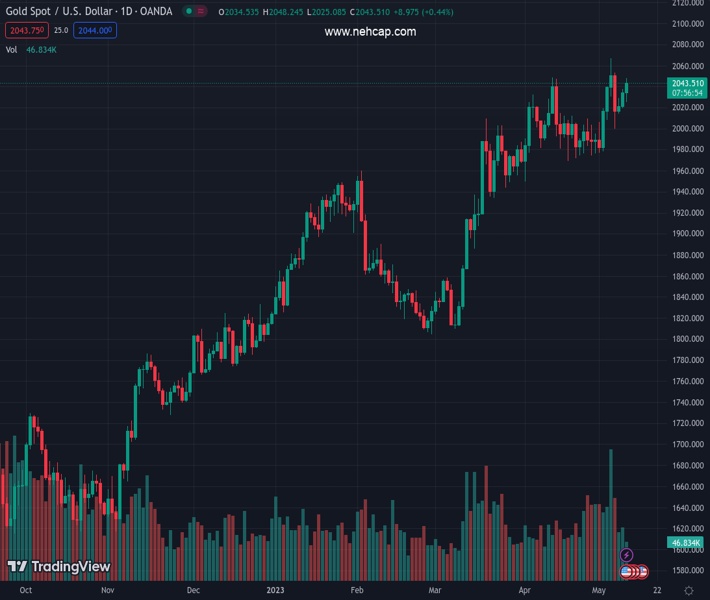
#XAUUSD @ 2,044.01 US Consumer Price Index rises 0.4% in April, matching market consensus. (Pivot Orderbook analysis)
…
This is a premium post.
[s2If !current_user_can(access_s2member_level4)]Please register for FREE REGISTER to read full post below containing analysis. In case of any error or you think you are not able to read the full post below, please email us at support#nehcap.com [lwa][/s2If] [s2If current_user_can(access_s2member_level1)]
- US Consumer Price Index rises 0.4% in April, matching market consensus.
- US Dollar Index tumbles after the report as US yields decline.
- XAU/USD jumps to highest since Friday, looking at $2,050.
The pair currently trades last at 2044.01.
The previous day high was 2037.65 while the previous day low was 2019.62. The daily 38.2% Fib levels comes at 2030.76, expected to provide support. Similarly, the daily 61.8% fib level is at 2026.51, expected to provide support.
Gold Price jumped following the release of US consumer inflation and the US Dollar dropped sharply across the board. XAU/USD rose from $2,030/oz to $2,045, reaching the highest level since Friday. Silver also soared, approaching $26.00.
The US Consumer Price Index (CPI) showed inflation rate was 0.4% in April, in line with expectations, and 4.9% YoY, slightly below the 5% of market consensus. The Core CPI rose 0.4% and the annual rate edged lower from 5.6% to 5.5%, both matching market consensus.
Following the numbers, the US Dollar Index turned negative, falling under 101.50. US Treasury bond yields also collapsed, with the 10-year falling to 3.45% from 3.50% and the 2-year to 3.94%.
XAU/USD is trading near the highs, looking at the $2,050 area, boosted by the weaker Dollar and also lower US yields. Above $2,050, attention would turn to the record highs in the $2,075/80 area. The immediate resistance now stands at $2,035.
Technical Levels: Supports and Resistances
XAUUSD currently trading at 2028.73 at the time of writing. Pair opened at 2034.41 and is trading with a change of -0.28 % .
| Overview | Overview.1 | |
|---|---|---|
| 0 | Today last price | 2028.73 |
| 1 | Today Daily Change | -5.68 |
| 2 | Today Daily Change % | -0.28 |
| 3 | Today daily open | 2034.41 |
The pair remains strongly bullish on the daily timeframe. It trades above its 20 SMA @ 2007.82, 50 SMA 1961.31, 100 SMA @ 1913.63 and 200 SMA @ 1817.25.
| Trends | Trends.1 | |
|---|---|---|
| 0 | Daily SMA20 | 2007.82 |
| 1 | Daily SMA50 | 1961.31 |
| 2 | Daily SMA100 | 1913.63 |
| 3 | Daily SMA200 | 1817.25 |
The previous day high was 2037.65 while the previous day low was 2019.62. The daily 38.2% Fib levels comes at 2030.76, expected to provide support. Similarly, the daily 61.8% fib level is at 2026.51, expected to provide support.
Note the levels of interest below:
- Pivot support is noted at 2023.47, 2012.53, 2005.44
- Pivot resistance is noted at 2041.5, 2048.59, 2059.53
| Levels | Levels.1 |
|---|---|
| Previous Daily High | 2037.65 |
| Previous Daily Low | 2019.62 |
| Previous Weekly High | 2079.76 |
| Previous Weekly Low | 1977.12 |
| Previous Monthly High | 2048.75 |
| Previous Monthly Low | 1949.83 |
| Daily Fibonacci 38.2% | 2030.76 |
| Daily Fibonacci 61.8% | 2026.51 |
| Daily Pivot Point S1 | 2023.47 |
| Daily Pivot Point S2 | 2012.53 |
| Daily Pivot Point S3 | 2005.44 |
| Daily Pivot Point R1 | 2041.50 |
| Daily Pivot Point R2 | 2048.59 |
| Daily Pivot Point R3 | 2059.53 |
[/s2If]
Nehcap Expert Advisor
The NEHCAP MT4 EA is high quality professional trading system geared to generate returns without using GRID or martingales. Each trade has strict risk per trade parameter. The pairs under management include EURUSD, GBPUSD, AUDCAD, AUDNZD,GBPAUD, EURAUD, EURCAD, CHFJPY and many more.
The system is trading live: LIVE ACCOUNT TRACKING
You can run it free. Apply for a free trial and track our account. Buy the system or use profit share mechanism to generate returns on your MT4.
Join Our Telegram Group
")


