WTI bulls take a breather after four-day uptrend, sidelined of late. (Pivot Orderbook analysis)
…
This is a premium post.
[s2If !current_user_can(access_s2member_level4)]Please register for FREE REGISTER to read full post below containing analysis. In case of any error or you think you are not able to read the full post below, please email us at support#nehcap.com [lwa][/s2If] [s2If current_user_can(access_s2member_level1)]
- WTI bulls take a breather after four-day uptrend, sidelined of late.
- US SPI refill concerns, geopolitical woes join sluggish US Dollar to favor Oil buyers.
- Mixed sentiment, recession fears and US debt-ceiling jitters weigh on commodity price.
- US CPI, EIA inventories will be eyed for clear directions.
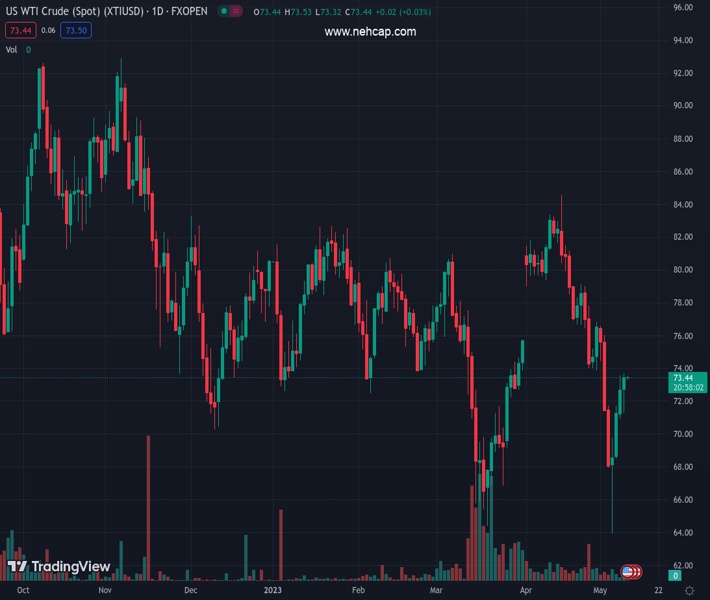
The pair currently trades last at 73.53.
The previous day high was 73.6 while the previous day low was 70.98. The daily 38.2% Fib levels comes at 72.6, expected to provide support. Similarly, the daily 61.8% fib level is at 71.98, expected to provide support.
WTI crude oil remains static around mid-$73.00s amid the early hours of Wednesday’s Asian session, after portraying a four-day rebound from the lowest levels since December 2021.
In doing so, the black gold price portrays the market’s cautious mood ahead of the key US inflation data, as well as mixed clues from the ongoing US debt-ceiling talks in the White House. However, talks of the US readiness to refill the US Strategic Petroleum Reserves (SPR) allow the WTI buyers to remain hopeful.
Reuters quotes a report by Bloomberg released on Tuesday afternoon that said that US President Joe Biden’s administration plans to begin purchasing crude oil to fill strategic crude oil reserves after completing maintenance later this year. The news also added, “The start of summer season in the Northern Hemisphere and voluntary production cuts by members of the Organization of the Petroleum Exporting Countries (OPEC) are expected to bolster oil prices.”
Alternatively, the weekly prints of the American Petroleum Institute’s (API) Crude Oil Stock data and firmer US Dollar prod the energy benchmark prices as the key lure buyers. That said, the weekly API inventories for the period ended on May 05 rose to 3.618M versus -3.939M prior.
Elsewhere, US Senate Majority Leader Chuck Schumer conveyed the absence of progress in the key debt-ceiling talks at the White House while International Monetary Fund (IMF) Chief Economist Pierre-Olivier Gourinchas said on Tuesday, “We are a bit concerned about recent banking sector turbulence.” The same could be heard from the Fed’s quarterly survey of bank loan officers, released on Monday.
While portraying the mood, the S&P 500 Futures remain sluggish whereas US Treasury bond yields grind higher and the US Dollar Index (DXY) struggles to extend the two-day rebound near 101.50.
Moving on, the US Consumer Price Index (CPI) for April and the official Weekly Crude Oil Stocks Change data from the US Energy Information Administration (EIA) will be crucial for clear directions.
A daily closing beyond the three-week-old descending resistance line, now immediate support near $72.65, keeps WTI buyers hopeful.
Technical Levels: Supports and Resistances
XTIUSD currently trading at 73.53 at the time of writing. Pair opened at 72.74 and is trading with a change of 1.09% % .
| Overview | Overview.1 | |
|---|---|---|
| 0 | Today last price | 73.53 |
| 1 | Today Daily Change | 0.79 |
| 2 | Today Daily Change % | 1.09% |
| 3 | Today daily open | 72.74 |
The pair remains strongly bearish on the daily time frame. It trades below the 20 SMA @ 76.73, 50 SMA 75.55, 100 SMA @ 76.79 and 200 SMA @ 80.87.
| Trends | Trends.1 | |
|---|---|---|
| 0 | Daily SMA20 | 76.73 |
| 1 | Daily SMA50 | 75.55 |
| 2 | Daily SMA100 | 76.79 |
| 3 | Daily SMA200 | 80.87 |
The previous day high was 73.6 while the previous day low was 70.98. The daily 38.2% Fib levels comes at 72.6, expected to provide support. Similarly, the daily 61.8% fib level is at 71.98, expected to provide support.
Note the levels of interest below:
- Pivot support is noted at 71.28, 69.83, 68.67
- Pivot resistance is noted at 73.9, 75.06, 76.51
| Levels | Levels.1 |
|---|---|
| Previous Daily High | 73.60 |
| Previous Daily Low | 70.98 |
| Previous Weekly High | 76.61 |
| Previous Weekly Low | 64.31 |
| Previous Monthly High | 83.40 |
| Previous Monthly Low | 73.88 |
| Daily Fibonacci 38.2% | 72.60 |
| Daily Fibonacci 61.8% | 71.98 |
| Daily Pivot Point S1 | 71.28 |
| Daily Pivot Point S2 | 69.83 |
| Daily Pivot Point S3 | 68.67 |
| Daily Pivot Point R1 | 73.90 |
| Daily Pivot Point R2 | 75.06 |
| Daily Pivot Point R3 | 76.51 |
[/s2If]
Nehcap Expert Advisor
The NEHCAP MT4 EA is high quality professional trading system geared to generate returns without using GRID or martingales. Each trade has strict risk per trade parameter. The pairs under management include EURUSD, GBPUSD, AUDCAD, AUDNZD,GBPAUD, EURAUD, EURCAD, CHFJPY and many more.
The system is trading live: LIVE ACCOUNT TRACKING
You can run it free. Apply for a free trial and track our account. Buy the system or use profit share mechanism to generate returns on your MT4.
Join Our Telegram Group
")


