#USDJPY @ 135.167 struggles to extend three-day uptrend within weekly bearish chart formation., @nehcap view: Further downside expected (Pivot Orderbook analysis)
…
This is a premium post.
[s2If !current_user_can(access_s2member_level4)]Please register for FREE REGISTER to read full post below containing analysis. In case of any error or you think you are not able to read the full post below, please email us at support#nehcap.com [lwa][/s2If] [s2If current_user_can(access_s2member_level1)]
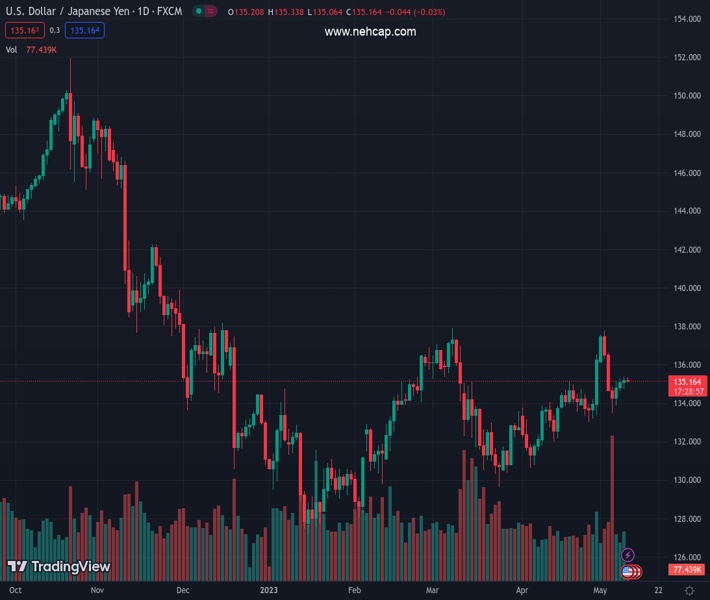
- USD/JPY struggles to extend three-day uptrend within weekly bearish chart formation.
- Steady oscillators suggest further grinding of Yen prices.
- 100, 200 SMAs and monthly support line act as additional downside filters.
- Bulls may aim for 138.00 on defying rising wedge pattern.
The pair currently trades last at 135.167.
The previous day high was 135.36 while the previous day low was 134.72. The daily 38.2% Fib levels comes at 135.12, expected to provide support. Similarly, the daily 61.8% fib level is at 134.97, expected to provide support.
USD/JPY retreats to 135.15 as it prods a three-day winning streak heading into Wednesday’s European session. In doing so, the Yen pair eases within a one-week-old rising wedge bearish chart pattern.
Sluggish MACD signals and a steady RSI (14) line hint at the USD/JPY pair’s further easing. However, a clear downside break of the stated wedge’s lower line, close to 135.00 by the press time, will confirm the wedge formation suggesting a theoretical fall toward the 133.00 round figure.
Though, the 100-bar Simple Moving Average (SMA) and an upward-sloping support line from April 13, respectively near 134.80 and 134.00, can prod the USD/JPY bears afterward.
It’s worth observing that the Yen pair’s run-up after crossing the 200-SMA level during mid-April highlights the stated key moving average, around 133.65 at the latest, as a major challenge for the bears.
Meanwhile, USD/JPY recovery may find multiple hurdles near 135.50, a break of which could direct the pair towards the stated wedge’s top line, near 135.90 as we write.
In a case where the Yen pair remains firmer past 135.90, the 136.00 round figure may act as an extra check for the bulls before pushing them for another battle with the 138.00 hurdle comprising tops marked in March and May 2023.
Trend: Further downside expected
Technical Levels: Supports and Resistances
USDJPY currently trading at 135.18 at the time of writing. Pair opened at 135.19 and is trading with a change of -0.01% % .
| Overview | Overview.1 | |
|---|---|---|
| 0 | Today last price | 135.18 |
| 1 | Today Daily Change | -0.01 |
| 2 | Today Daily Change % | -0.01% |
| 3 | Today daily open | 135.19 |
The pair is trading above its 20 Daily moving average @ 134.56, above its 50 Daily moving average @ 133.84 , above its 100 Daily moving average @ 132.85 and below its 200 Daily moving average @ 137.02
| Trends | Trends.1 | |
|---|---|---|
| 0 | Daily SMA20 | 134.56 |
| 1 | Daily SMA50 | 133.84 |
| 2 | Daily SMA100 | 132.85 |
| 3 | Daily SMA200 | 137.02 |
The previous day high was 135.36 while the previous day low was 134.72. The daily 38.2% Fib levels comes at 135.12, expected to provide support. Similarly, the daily 61.8% fib level is at 134.97, expected to provide support.
Note the levels of interest below:
- Pivot support is noted at 134.82, 134.45, 134.18
- Pivot resistance is noted at 135.46, 135.73, 136.1
| Levels | Levels.1 |
|---|---|
| Previous Daily High | 135.36 |
| Previous Daily Low | 134.72 |
| Previous Weekly High | 137.78 |
| Previous Weekly Low | 133.50 |
| Previous Monthly High | 136.56 |
| Previous Monthly Low | 130.63 |
| Daily Fibonacci 38.2% | 135.12 |
| Daily Fibonacci 61.8% | 134.97 |
| Daily Pivot Point S1 | 134.82 |
| Daily Pivot Point S2 | 134.45 |
| Daily Pivot Point S3 | 134.18 |
| Daily Pivot Point R1 | 135.46 |
| Daily Pivot Point R2 | 135.73 |
| Daily Pivot Point R3 | 136.10 |
[/s2If]
Nehcap Expert Advisor
The NEHCAP MT4 EA is high quality professional trading system geared to generate returns without using GRID or martingales. Each trade has strict risk per trade parameter. The pairs under management include EURUSD, GBPUSD, AUDCAD, AUDNZD,GBPAUD, EURAUD, EURCAD, CHFJPY and many more.
The system is trading live: LIVE ACCOUNT TRACKING
You can run it free. Apply for a free trial and track our account. Buy the system or use profit share mechanism to generate returns on your MT4.
Join Our Telegram Group
")


