#USDCAD @ 1.33795 has sensed selling pressure after a recovery move to near 1.3400 as oil prices eye more upside. (Pivot Orderbook analysis)
…
This is a premium post.
[s2If !current_user_can(access_s2member_level4)]Please register for FREE REGISTER to read full post below containing analysis. In case of any error or you think you are not able to read the full post below, please email us at support#nehcap.com [lwa][/s2If] [s2If current_user_can(access_s2member_level1)]
- USD/CAD has sensed selling pressure after a recovery move to near 1.3400 as oil prices eye more upside.
- US President Joe Biden is interested in a separate discussion for the budget.
- If US inflation remains persistent, the Fed would start preparing for hiking interest rates further.
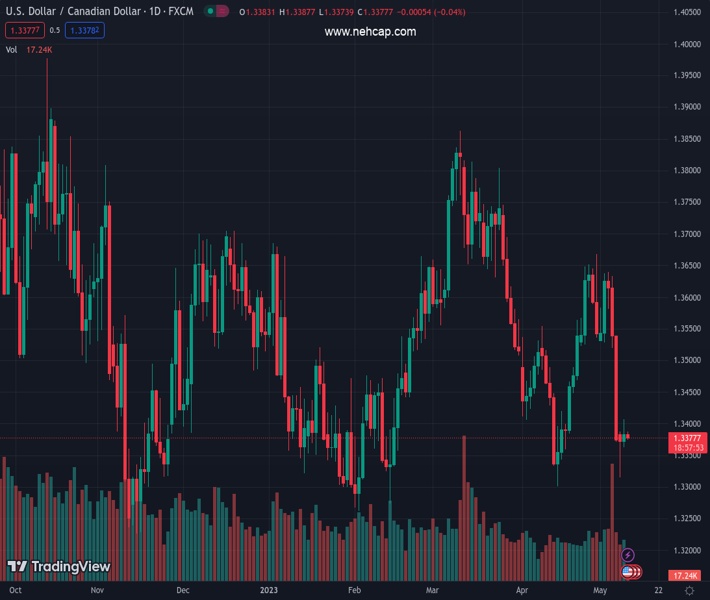
The pair currently trades last at 1.33795.
The previous day high was 1.3406 while the previous day low was 1.3365. The daily 38.2% Fib levels comes at 1.3391, expected to provide resistance. Similarly, the daily 61.8% fib level is at 1.3381, expected to provide resistance.
The USD/CAD pair has sensed selling pressures after a rebound to near the round-level resistance of 1.3400 in the Asian session. The Loonie asset has faced selling interest as the US Dollar Index (DXY) has extended its correction further to 101.55 after US debt ceiling negotiations failed a decisive outcome.
S&P500 futures have added decent gains in Asia amid a decline in the USD Index’s appeal as a safe-haven. However, the overall market mood is risk averse as a delay in the US debt ceiling outcome could impact the long-term outlook of the US economy. This would have a significant impact on US equities.
US President Joe Biden is interested in a separate discussion of the budget but is not interested in spending cuts for the approval of a debt-ceiling increase. The street is anticipating a bipartisan agreement between the White House and Republicans as US default on obligated payments is not an option.
As delegates will meet again for US debt ceiling negotiations on Friday, investors are shifting their focus toward the release of the US Consumer Price Index (CPI) data. Monthly headline inflation is seen accelerating by 0.4% vs. the former pace of 0.1%. Annual headline inflation is expected to remain steady at 5.0% while core CPI that excludes oil and food prices is seen softening to 5.5% from the prior release of 5.6%.
If US inflation remains persistent, the Federal Reserve (Fed) would start preparing for hiking interest rates further as its major agenda is to achieve price stability.
On the oil front, oil prices are gathering strength for a fresh rally above the immediate resistance of $73.50 as investors have digested fresh interest rate hikes from the Fed and the European Central Bank (ECB). Going forward, investors will keep an eye on the oil inventories to be reported by US Energy Information Administration (EIA) for the week ending May 05.
It is worth noting that Canada is the leading exporter of oil to the United States and higher oil prices will support the Canadian Dollar.
Technical Levels: Supports and Resistances
USDCAD currently trading at 1.3376 at the time of writing. Pair opened at 1.3384 and is trading with a change of -0.06 % .
| Overview | Overview.1 | |
|---|---|---|
| 0 | Today last price | 1.3376 |
| 1 | Today Daily Change | -0.0008 |
| 2 | Today Daily Change % | -0.0600 |
| 3 | Today daily open | 1.3384 |
The pair remains strongly bearish on the daily time frame. It trades below the 20 SMA @ 1.3491, 50 SMA 1.3576, 100 SMA @ 1.3518 and 200 SMA @ 1.3452.
| Trends | Trends.1 | |
|---|---|---|
| 0 | Daily SMA20 | 1.3491 |
| 1 | Daily SMA50 | 1.3576 |
| 2 | Daily SMA100 | 1.3518 |
| 3 | Daily SMA200 | 1.3452 |
The previous day high was 1.3406 while the previous day low was 1.3365. The daily 38.2% Fib levels comes at 1.3391, expected to provide resistance. Similarly, the daily 61.8% fib level is at 1.3381, expected to provide resistance.
Note the levels of interest below:
- Pivot support is noted at 1.3364, 1.3344, 1.3323
- Pivot resistance is noted at 1.3405, 1.3426, 1.3446
| Levels | Levels.1 |
|---|---|
| Previous Daily High | 1.3406 |
| Previous Daily Low | 1.3365 |
| Previous Weekly High | 1.3639 |
| Previous Weekly Low | 1.3371 |
| Previous Monthly High | 1.3668 |
| Previous Monthly Low | 1.3301 |
| Daily Fibonacci 38.2% | 1.3391 |
| Daily Fibonacci 61.8% | 1.3381 |
| Daily Pivot Point S1 | 1.3364 |
| Daily Pivot Point S2 | 1.3344 |
| Daily Pivot Point S3 | 1.3323 |
| Daily Pivot Point R1 | 1.3405 |
| Daily Pivot Point R2 | 1.3426 |
| Daily Pivot Point R3 | 1.3446 |
[/s2If]
Nehcap Expert Advisor
The NEHCAP MT4 EA is high quality professional trading system geared to generate returns without using GRID or martingales. Each trade has strict risk per trade parameter. The pairs under management include EURUSD, GBPUSD, AUDCAD, AUDNZD,GBPAUD, EURAUD, EURCAD, CHFJPY and many more.
The system is trading live: LIVE ACCOUNT TRACKING
You can run it free. Apply for a free trial and track our account. Buy the system or use profit share mechanism to generate returns on your MT4.
Join Our Telegram Group
")


