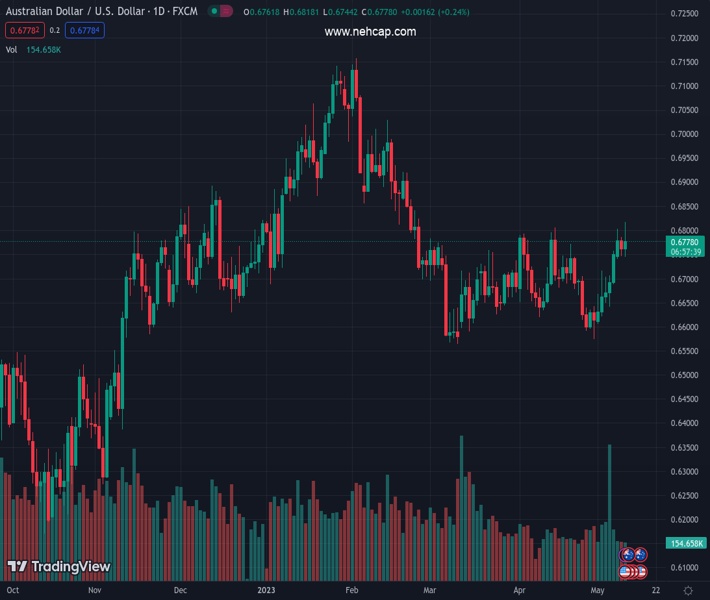
#AUDUSD @ 0.67783 US Consumer Price Index rises 0.4% in April, in line with market estimates. (Pivot Orderbook analysis)
…
This is a premium post.
[s2If !current_user_can(access_s2member_level4)]Please register for FREE REGISTER to read full post below containing analysis. In case of any error or you think you are not able to read the full post below, please email us at support#nehcap.com [lwa][/s2If] [s2If current_user_can(access_s2member_level1)]
- US Consumer Price Index rises 0.4% in April, in line with market estimates.
- US Dollar tumbles across the board after the report.
- AUD/USD jumps to 0.6817 and then trims gains.
The pair currently trades last at 0.67783.
The previous day high was 0.6787 while the previous day low was 0.6746. The daily 38.2% Fib levels comes at 0.6762, expected to provide support. Similarly, the daily 61.8% fib level is at 0.6771, expected to provide support.
The AUD/USD pair jumped to 0.6817 after US April inflation data. The pair then pulled back and after Wall Street’s opening bell, it is hovering around 0.6790, up almost 40 pips for the day.
Data release in the US revealed that the US Consumer Price Index (CPI) rose 0.4% in April, in line with expectations, and 4.9% YoY, slightly below the 5% of market consensus. The Core CPI rose 0.4% and the annual rate edged lower from 5.6% to 5.5%, both matching market consensus. On Thursday, the April Producer Price Index (PPI) is due. More evidence of slowing inflation could weigh further on the US Dollar.
The US Dollar Index dropped to 101.21 and then rebounded to 101.40 as US yields moved off lows. Commodity prices soared and then pulled back. In Wall Street, the Dow Jones is up by 0.29% and the Nasdaq gains 1.03%.
The AUD/USD holds a bullish tone, however it is pulling back after being rejected again from above 0.6800. The Aussie needs to hold firm above that area to open the doors to more gains. On the flip side, support emerges at 0.6770 followed by 0.6745.
Technical Levels: Supports and Resistances
AUDUSD currently trading at 0.6795 at the time of writing. Pair opened at 0.6762 and is trading with a change of 0.49 % .
| Overview | Overview.1 | |
|---|---|---|
| 0 | Today last price | 0.6795 |
| 1 | Today Daily Change | 0.0033 |
| 2 | Today Daily Change % | 0.4900 |
| 3 | Today daily open | 0.6762 |
The pair remains strongly bullish on the daily timeframe. It trades above its 20 SMA @ 0.6693, 50 SMA 0.6685, 100 SMA @ 0.679 and 200 SMA @ 0.6727.
| Trends | Trends.1 | |
|---|---|---|
| 0 | Daily SMA20 | 0.6693 |
| 1 | Daily SMA50 | 0.6685 |
| 2 | Daily SMA100 | 0.6790 |
| 3 | Daily SMA200 | 0.6727 |
The previous day high was 0.6787 while the previous day low was 0.6746. The daily 38.2% Fib levels comes at 0.6762, expected to provide support. Similarly, the daily 61.8% fib level is at 0.6771, expected to provide support.
Note the levels of interest below:
- Pivot support is noted at 0.6743, 0.6725, 0.6703
- Pivot resistance is noted at 0.6784, 0.6805, 0.6824
| Levels | Levels.1 |
|---|---|
| Previous Daily High | 0.6787 |
| Previous Daily Low | 0.6746 |
| Previous Weekly High | 0.6757 |
| Previous Weekly Low | 0.6607 |
| Previous Monthly High | 0.6806 |
| Previous Monthly Low | 0.6574 |
| Daily Fibonacci 38.2% | 0.6762 |
| Daily Fibonacci 61.8% | 0.6771 |
| Daily Pivot Point S1 | 0.6743 |
| Daily Pivot Point S2 | 0.6725 |
| Daily Pivot Point S3 | 0.6703 |
| Daily Pivot Point R1 | 0.6784 |
| Daily Pivot Point R2 | 0.6805 |
| Daily Pivot Point R3 | 0.6824 |
[/s2If]
Nehcap Expert Advisor
The NEHCAP MT4 EA is high quality professional trading system geared to generate returns without using GRID or martingales. Each trade has strict risk per trade parameter. The pairs under management include EURUSD, GBPUSD, AUDCAD, AUDNZD,GBPAUD, EURAUD, EURCAD, CHFJPY and many more.
The system is trading live: LIVE ACCOUNT TRACKING
You can run it free. Apply for a free trial and track our account. Buy the system or use profit share mechanism to generate returns on your MT4.
Join Our Telegram Group
")


