Asian markets are demonstrating negative market sentiment as US Inflation has come into the picture. (Pivot Orderbook analysis)
…
This is a premium post.
[s2If !current_user_can(access_s2member_level4)]Please register for FREE REGISTER to read full post below containing analysis. In case of any error or you think you are not able to read the full post below, please email us at support#nehcap.com [lwa][/s2If] [s2If current_user_can(access_s2member_level1)]
- Asian markets are demonstrating negative market sentiment as US Inflation has come into the picture.
- US President Joe Biden wants approval of the debt ceiling raise without compromising spending initiatives.
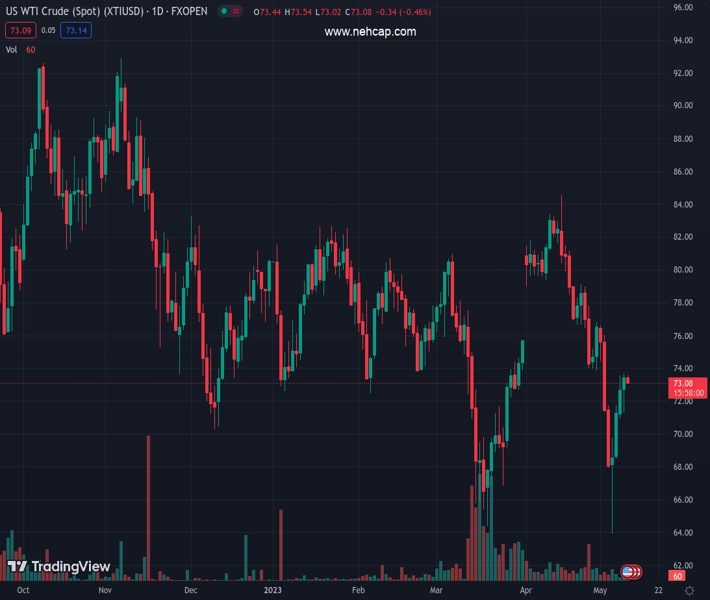
- Oil prices have witnessed some correction as investors are awaiting the oil inventory data for the week ending May 05.
The pair currently trades last at 29214.94.
The previous day high was 29253.19 while the previous day low was 29044.19. The daily 38.2% Fib levels comes at 29173.35, expected to provide support. Similarly, the daily 61.8% fib level is at 29124.03, expected to provide support.
Markets in the Asian domain are showing sheer volatility as investors are anxious ahead of the release of the United States inflation data. The bigger picture for the global market is the US Consumer Price Index (CPI) data as US debt ceiling negotiations have adjourned till Friday. Negotiations among White House officials and Republican leaders remained heated as the former wants approval of a debt ceiling raise without compromising spending initiatives while Republican House of Representatives Speaker Kevin McCarthy already made clear that he won’t approve debt ceiling raise without cutting President’s spending initiative to safeguard escalating budget deficit.
At the press time, Japan’s Nikkei225 dropped 0.50%, Shanghai plunged 1.40%, Hang Seng battered 0.64%, and Nifty50 slipped 0.18%.
As US Nonfarm Payrolls (NFP) report for April was extremely solid, investors are worried that a rebound in US inflation would renew fears of more interest rate hikes from the Federal Reserve (Fed). As per the estimates, monthly headline and core CPI are seen rising at a pace of 0.4% higher than the pace recorded in March. However, the Fed would be in more difficulty as tight credit conditions and consistently declining manufacturing activities are already putting pressure on the US economy.
Meanwhile, Chinese stocks have dropped significantly ahead of Thursday’s inflation data. Monthly inflation is seen as stagnant against March’s deceleration of 0.3%. Annual inflation is expected to accelerate by 0.3% at a slower pace vs. the prior release of 0.7%. It is worth noting that the Chinese economy has been facing deflation due to bleak domestic demand.
Japanese equities are expected to show a power-pack action ahead of the release of the Bank of Japan (BoJ) Summary of Opinions. The BoJ Summary of Opinions will provide a detailed explanation behind keeping the monetary policy ultra-dovish in April.
On the oil front, oil prices have witnessed some correction after failing to extend recovery above $74.00 as investors are awaiting the oil inventory data for the week ending May 05 to be released by US Energy Information Administration (EIA).
Technical Levels: Supports and Resistances
XTIUSD currently trading at 29214.94 at the time of writing. Pair opened at 29214.94 and is trading with a change of 0.0 % .
| Overview | Overview.1 | |
|---|---|---|
| 0 | Today last price | 29214.94 |
| 1 | Today Daily Change | 0.00 |
| 2 | Today Daily Change % | 0.00 |
| 3 | Today daily open | 29214.94 |
The pair remains strongly bullish on the daily timeframe. It trades above its 20 SMA @ 28679.82, 50 SMA 28105.84, 100 SMA @ 27503.76 and 200 SMA @ 27592.56.
| Trends | Trends.1 | |
|---|---|---|
| 0 | Daily SMA20 | 28679.82 |
| 1 | Daily SMA50 | 28105.84 |
| 2 | Daily SMA100 | 27503.76 |
| 3 | Daily SMA200 | 27592.56 |
The previous day high was 29253.19 while the previous day low was 29044.19. The daily 38.2% Fib levels comes at 29173.35, expected to provide support. Similarly, the daily 61.8% fib level is at 29124.03, expected to provide support.
Note the levels of interest below:
- Pivot support is noted at 29088.36, 28961.77, 28879.36
- Pivot resistance is noted at 29297.36, 29379.77, 29506.36
| Levels | Levels.1 |
|---|---|
| Previous Daily High | 29253.19 |
| Previous Daily Low | 29044.19 |
| Previous Weekly High | 29284.92 |
| Previous Weekly Low | 28544.43 |
| Previous Monthly High | 29058.52 |
| Previous Monthly Low | 27562.51 |
| Daily Fibonacci 38.2% | 29173.35 |
| Daily Fibonacci 61.8% | 29124.03 |
| Daily Pivot Point S1 | 29088.36 |
| Daily Pivot Point S2 | 28961.77 |
| Daily Pivot Point S3 | 28879.36 |
| Daily Pivot Point R1 | 29297.36 |
| Daily Pivot Point R2 | 29379.77 |
| Daily Pivot Point R3 | 29506.36 |
[/s2If]
Nehcap Expert Advisor
The NEHCAP MT4 EA is high quality professional trading system geared to generate returns without using GRID or martingales. Each trade has strict risk per trade parameter. The pairs under management include EURUSD, GBPUSD, AUDCAD, AUDNZD,GBPAUD, EURAUD, EURCAD, CHFJPY and many more.
The system is trading live: LIVE ACCOUNT TRACKING
You can run it free. Apply for a free trial and track our account. Buy the system or use profit share mechanism to generate returns on your MT4.
Join Our Telegram Group
")


