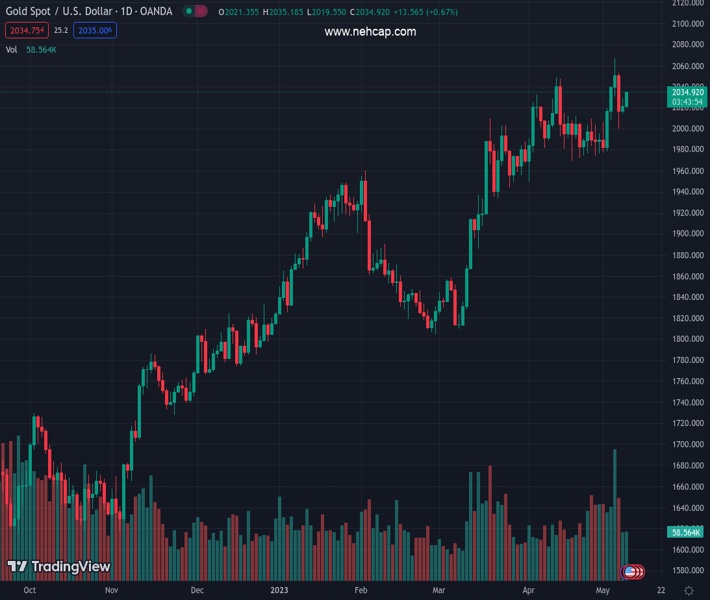
#XAUUSD @ 2,034.13 rallies, benefiting from concerns over the US debt ceiling and slowing Chinese manufacturing activity. (Pivot Orderbook analysis)
…
This is a premium post.
[s2If !current_user_can(access_s2member_level4)]Please register for FREE REGISTER to read full post below containing analysis. In case of any error or you think you are not able to read the full post below, please email us at support#nehcap.com [lwa][/s2If] [s2If current_user_can(access_s2member_level1)]
- XAU/USD rallies, benefiting from concerns over the US debt ceiling and slowing Chinese manufacturing activity.
- Falling US Treasury bond yields support gold prices despite strong US Dollar.
- Eyes on upcoming US CPI data, which has the potential to impact gold prices.
The pair currently trades last at 2034.13.
The previous day high was 2029.41 while the previous day low was 2014.36. The daily 38.2% Fib levels comes at 2023.66, expected to provide support. Similarly, the daily 61.8% fib level is at 2020.11, expected to provide support.
Gold price is printing back-to-back bullish days as the XAU/USD meanders nearby Monday’s high of $2029.40, bolstered by falling US Treasury bond yields despite a strong US Dollar (USD). The XAU/USD is underpinned by uncertainty around the US debt ceiling and a US inflation report looming. At the time of writing, the XAU/USD is trading at $2030.68, above its opening price by 0.48%.
The negative tone is being reflected by Wall Street registering losses. Worries about politics, namely the debt ceiling, weighed on market sentiment. Credit conditions in the United States (US) began to tighten, as shown by the Fed’s Senior Loan Officer Opinion Survey (SLOOS), though “not as disastrous as many doomsayers had feared,” Analysts at Brown Brothers Harriman noted.
Another reason that bolstered appetite for XAU/USD was that China’s revealed that manufacturing activity slowed down. At the same time, its Trade Balance showed that Exports and Imports dropped from 14.8% to 8.5% in April and from -1.4% to -7.9%, respectively.
On Tuesday, US President Joe Biden will host US Congress officials to lay the ground around getting a consensus on the US debt ceiling.
In the meantime, the US Dollar Index (DXY), a gauge that tracks the performance of six currencies against the US Dollar, climbs 0.29%, up at 101.680, capping XAU/USD’s rally. US Treasury bond yields are mixed, though the short term, the most sensitive to interest rates, the 2-year note gains one bps, at 4.024%.
In the meantime, the Fed parade has begun, led by Fed Governor Philip Jefferson, who said the banking system was sound and resilient and that institutions had begun to raise lending standards. Regarding inflation, it has started to slow in an “orderly fashion” and will come down as the economy continues to grow.
Of late, the New York Fed President John Williams stated, “We haven’t said we are done,” adding that it would be data dependent and could raise rates if needed.
On the US front, the Consumer Price Index (CPI) for April is expected at 5% YoY, while the core reading is at 5.5%.
The XAU/USD recovered some ground after testing the 20-day EMA at $2006.62, which also intersected with a one-month-old upslope support trendline. However, it’s facing solid resistance at around the April 5 high of $2032.13, which, if broken, would clear the way for XAU/USD to challenge the April 13 high at $2048.79.
On the flip side, the XAU/USD first support would be the 20-day EMA at $2006.83, followed by the $2000 figure. Once broken, it would expose the April 19 swing lows at $1969.34.
Technical Levels: Supports and Resistances
XAUUSD currently trading at 2031.05 at the time of writing. Pair opened at 2021.16 and is trading with a change of 0.49 % .
| Overview | Overview.1 | |
|---|---|---|
| 0 | Today last price | 2031.05 |
| 1 | Today Daily Change | 9.89 |
| 2 | Today Daily Change % | 0.49 |
| 3 | Today daily open | 2021.16 |
The pair remains strongly bullish on the daily timeframe. It trades above its 20 SMA @ 2006.29, 50 SMA 1956.97, 100 SMA @ 1911.16 and 200 SMA @ 1815.94.
| Trends | Trends.1 | |
|---|---|---|
| 0 | Daily SMA20 | 2006.29 |
| 1 | Daily SMA50 | 1956.97 |
| 2 | Daily SMA100 | 1911.16 |
| 3 | Daily SMA200 | 1815.94 |
The previous day high was 2029.41 while the previous day low was 2014.36. The daily 38.2% Fib levels comes at 2023.66, expected to provide support. Similarly, the daily 61.8% fib level is at 2020.11, expected to provide support.
Note the levels of interest below:
- Pivot support is noted at 2013.88, 2006.59, 1998.83
- Pivot resistance is noted at 2028.93, 2036.69, 2043.98
| Levels | Levels.1 |
|---|---|
| Previous Daily High | 2029.41 |
| Previous Daily Low | 2014.36 |
| Previous Weekly High | 2079.76 |
| Previous Weekly Low | 1977.12 |
| Previous Monthly High | 2048.75 |
| Previous Monthly Low | 1949.83 |
| Daily Fibonacci 38.2% | 2023.66 |
| Daily Fibonacci 61.8% | 2020.11 |
| Daily Pivot Point S1 | 2013.88 |
| Daily Pivot Point S2 | 2006.59 |
| Daily Pivot Point S3 | 1998.83 |
| Daily Pivot Point R1 | 2028.93 |
| Daily Pivot Point R2 | 2036.69 |
| Daily Pivot Point R3 | 2043.98 |
[/s2If]
Nehcap Expert Advisor
The NEHCAP MT4 EA is high quality professional trading system geared to generate returns without using GRID or martingales. Each trade has strict risk per trade parameter. The pairs under management include EURUSD, GBPUSD, AUDCAD, AUDNZD,GBPAUD, EURAUD, EURCAD, CHFJPY and many more.
The system is trading live: LIVE ACCOUNT TRACKING
You can run it free. Apply for a free trial and track our account. Buy the system or use profit share mechanism to generate returns on your MT4.
Join Our Telegram Group
")


