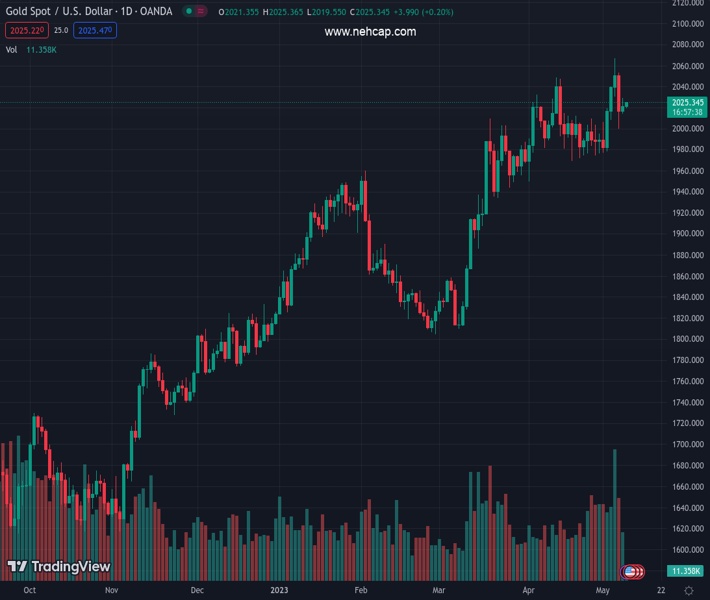
#XAUUSD @ 2,024.94 Gold price prints mild gains to pare Friday’s heavy losses during two-day rebound., @nehcap view: Gradual upside expected (Pivot Orderbook analysis)
…
This is a premium post.
[s2If !current_user_can(access_s2member_level4)]Please register for FREE REGISTER to read full post below containing analysis. In case of any error or you think you are not able to read the full post below, please email us at support#nehcap.com [lwa][/s2If] [s2If current_user_can(access_s2member_level1)]
- Gold price prints mild gains to pare Friday’s heavy losses during two-day rebound.
- Market sentiment remains dicey amid unimpressive Fed bank survey details.
- Cautious mood ahead of US debt ceiling talks, mixed Fed talks keep XAU/USD traders on their toes.
The pair currently trades last at 2024.94.
The previous day high was 2029.41 while the previous day low was 2014.36. The daily 38.2% Fib levels comes at 2023.66, expected to provide support. Similarly, the daily 61.8% fib level is at 2020.11, expected to provide support.
Gold price (XAU/USD) edges higher past $2,000 round figure as it consolidates Friday’s heavy losses during a two-day uptrend to early Tuesday, up 0.12% intraday near $2,023 by the press time.
In doing so, the yellow metal benefits from the market’s cautious mood ahead of the US negotiations on avoiding the default. However, the recent rebound in the US Dollar and the Treasury bond yields, as well as inflation expectations, prod the XAU/USD buyers amid a sluggish session.
US Dollar Index (DXY) defends the previous day’s rebound near 101.50 amid firmer signals from the US inflation expectations per 10-year and 5-year breakeven inflation rates from the St. Louis Federal Reserve (FRED) data. Also favoring the greenback’s gauge could be the market’s fears fuelled by comments from US Treasury Secretary Janet Yellen’s actions. Reuters shares news suggesting US Treasury Secretary Janet Yellen’s personal reaching out to business and financial leaders to explain the “catastrophic” impact a US default on its debt would have on the U.S. and global economies, two sources familiar with the matter said on Monday.
On the contrary, unimpressive details of the Federal Reserve’s (Fed) quarterly bank loan survey, showed tighter standards and weaker demand for commercial and industrial (C&I) loans to large and middle-market firms, as well as small firms, over the first quarter, seem to prod the XAU/USD traders.
As a result, S&P 500 Futures struggle for clear directions despite posting mild losses around 4,150 whereas the US 10-year and two-year Treasury bond yields struggle to extend the three-day uptrend during early Tuesday.
Looking forward, a light calendar may allow the Gold price to grind higher ahead of the key debt-ceiling talks in the White House. Any negative outcome, which is more likely, can weigh on the US Dollar and propel the XAU/USD.
Gold price grinds higher within a $20 trading range comprising the 100-Hour Moving Average (HMA) and the 200-HMA, respectively near $2,030 and $2,010.
Adding strength to the upside filter is a one-week-old horizontal resistance zone while an upward-sloping trend line from the last Tuesday increases the strength of the $2,010 support confluence.
That said, sluggish MACD signals and steady RSI (14) suggest the continuation of the XAU/USD’s slower grind towards the north.
It’s worth noting that $2,060 holds the key for the Gold price rally towards refreshing the all-time high, currently around $2,080, whereas the $2,000 psychological magnet acts as an additional downside filter to watch for the XAU/USD bears before taking control.
Trend: Gradual upside expected
Technical Levels: Supports and Resistances
XAUUSD currently trading at 2022.92 at the time of writing. Pair opened at 2021.16 and is trading with a change of 0.09% % .
| Overview | Overview.1 | |
|---|---|---|
| 0 | Today last price | 2022.92 |
| 1 | Today Daily Change | 1.76 |
| 2 | Today Daily Change % | 0.09% |
| 3 | Today daily open | 2021.16 |
The pair remains strongly bullish on the daily timeframe. It trades above its 20 SMA @ 2006.29, 50 SMA 1956.97, 100 SMA @ 1911.16 and 200 SMA @ 1815.94.
| Trends | Trends.1 | |
|---|---|---|
| 0 | Daily SMA20 | 2006.29 |
| 1 | Daily SMA50 | 1956.97 |
| 2 | Daily SMA100 | 1911.16 |
| 3 | Daily SMA200 | 1815.94 |
The previous day high was 2029.41 while the previous day low was 2014.36. The daily 38.2% Fib levels comes at 2023.66, expected to provide support. Similarly, the daily 61.8% fib level is at 2020.11, expected to provide support.
Note the levels of interest below:
- Pivot support is noted at 2013.88, 2006.59, 1998.83
- Pivot resistance is noted at 2028.93, 2036.69, 2043.98
| Levels | Levels.1 |
|---|---|
| Previous Daily High | 2029.41 |
| Previous Daily Low | 2014.36 |
| Previous Weekly High | 2079.76 |
| Previous Weekly Low | 1977.12 |
| Previous Monthly High | 2048.75 |
| Previous Monthly Low | 1949.83 |
| Daily Fibonacci 38.2% | 2023.66 |
| Daily Fibonacci 61.8% | 2020.11 |
| Daily Pivot Point S1 | 2013.88 |
| Daily Pivot Point S2 | 2006.59 |
| Daily Pivot Point S3 | 1998.83 |
| Daily Pivot Point R1 | 2028.93 |
| Daily Pivot Point R2 | 2036.69 |
| Daily Pivot Point R3 | 2043.98 |
[/s2If]
Nehcap Expert Advisor
The NEHCAP MT4 EA is high quality professional trading system geared to generate returns without using GRID or martingales. Each trade has strict risk per trade parameter. The pairs under management include EURUSD, GBPUSD, AUDCAD, AUDNZD,GBPAUD, EURAUD, EURCAD, CHFJPY and many more.
The system is trading live: LIVE ACCOUNT TRACKING
You can run it free. Apply for a free trial and track our account. Buy the system or use profit share mechanism to generate returns on your MT4.
Join Our Telegram Group
")


