#USDMXN @ 17.7536 Mexico’s inflation slows for the third consecutive month, prompting expectations of a pause in rate hikes. (Pivot Orderbook analysis)
…
This is a premium post.
[s2If !current_user_can(access_s2member_level4)]Please register for FREE REGISTER to read full post below containing analysis. In case of any error or you think you are not able to read the full post below, please email us at support#nehcap.com [lwa][/s2If] [s2If current_user_can(access_s2member_level1)]
- Mexico’s inflation slows for the third consecutive month, prompting expectations of a pause in rate hikes.
- US debt ceiling issues and Federal Reserve speakers take the spotlight, impacting market sentiment.
- USD/MXN’s future direction may hinge on upcoming US inflation data, with a breach of key levels possible.
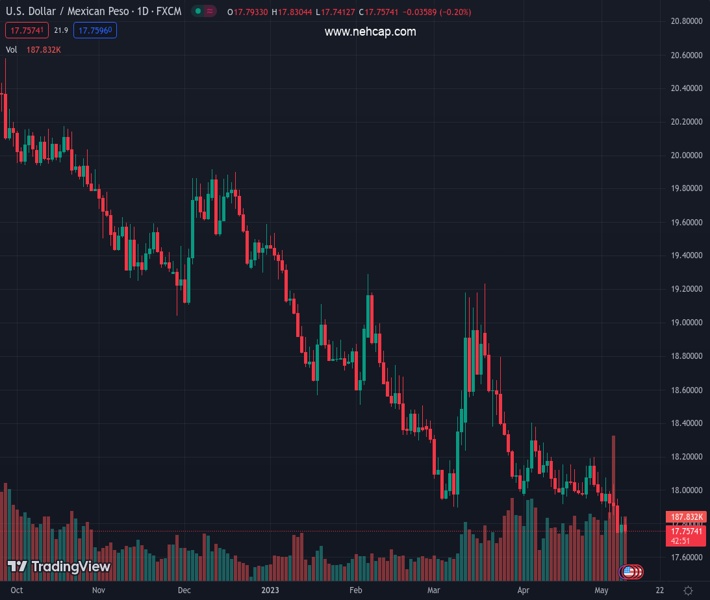
The pair currently trades last at 17.7536.
The previous day high was 17.8405 while the previous day low was 17.7403. The daily 38.2% Fib levels comes at 17.8022, expected to provide resistance. Similarly, the daily 61.8% fib level is at 17.7786, expected to provide resistance.
USD/MXN slides towards the 17.7000 area after a better-than-expected inflation report in Mexico could open the door for a pause on Mexico’s central bank. Although it’s usually a sign that should weaken the currency, falling US bond yields underpinned the USD/MXN pair, albeit the overall US Dollar (USD) strength. The USD/MXN is trading at 17.7687, down 0.17%.
USD/MXN resumed its downtrend after INEGI reported that inflation in Mexico slowed for the third straight month in April to 6.25% from 6.85% YoY. The Consumer Price Index (CPI) in Mexico plunged 0.02% MoM, while the core CPI rose 0.39% MoM, while annually based stood at 7.67%.
The Bank of Mexico (Banxico’s) hiked rates 25 bps in the March meeting to 11.25% while opening the door for a pause. Today’s inflation report could pave the way for a pause in the May 18 meeting, as shown by a poll by Citibanmes, which showed that most market participants estimate Banxico to keep rates unchanged.
Aside from this, the US debt ceiling theme in the United States (US) is taking all the headlines. On Monday, the US Secretary of Treasury Janet Yellen said that the government would run out of cash by June 1, adding that it would be a “huge hit” adding that a default would have “tremendously adverse effects” on the financial markets.
Meanwhile, Federal Reserve speakers Jefferson and the New York (NY) Fed President Williams crossed newswires. Jefferson commented about the banking system and added that inflation is slowing down in an “orderly fashion” but omitted to speak regarding his posture for the next meeting. Contrarily, John Williams of the NY Fed said, “We haven’t said we are done,” increasing interest rates, emphasizing that the only change is that the US central bank would be data dependent.
Given the backdrop, further upside in the USD/MXN was warranted, but the release of inflation data in the United States (US) would determine the fate of the USD/MXN. If April’s US CPI exceeds estimates to the upside, the USD/MXN would be bolstered by expectations for further tightening by the Fed. Otherwise, the USD/MXN could print another leg down and challenge the current year-to-date (YTD) low of 17.7392, on its way toward the July 2017 low of 17.45.
USD/MXN bounced off the YTD lows, printing a weekly high of 17.8404 before reversing its course. If USD/MXN buyers want to reclaim control, they must crack the 20-day EMA at 17.9722. A breach of the latter will expose the 18.00 handle, followed by the 50-day EMA at 18.1850, before posing a threat of the 100-day EMA At 18.5142. Conversely, USD/MXN could print a new six-year low beneath 17.7392, at around 17.50, followed by the July 2017 low.
Technical Levels: Supports and Resistances
USDMXN currently trading at 17.7646 at the time of writing. Pair opened at 17.796 and is trading with a change of -0.18 % .
| Overview | Overview.1 | |
|---|---|---|
| 0 | Today last price | 17.7646 |
| 1 | Today Daily Change | -0.0314 |
| 2 | Today Daily Change % | -0.1800 |
| 3 | Today daily open | 17.7960 |
The pair remains strongly bearish on the daily time frame. It trades below the 20 SMA @ 17.998, 50 SMA 18.2073, 100 SMA @ 18.5683 and 200 SMA @ 19.2182.
| Trends | Trends.1 | |
|---|---|---|
| 0 | Daily SMA20 | 17.9980 |
| 1 | Daily SMA50 | 18.2073 |
| 2 | Daily SMA100 | 18.5683 |
| 3 | Daily SMA200 | 19.2182 |
The previous day high was 17.8405 while the previous day low was 17.7403. The daily 38.2% Fib levels comes at 17.8022, expected to provide resistance. Similarly, the daily 61.8% fib level is at 17.7786, expected to provide resistance.
Note the levels of interest below:
- Pivot support is noted at 17.744, 17.692, 17.6438
- Pivot resistance is noted at 17.8442, 17.8925, 17.9445
| Levels | Levels.1 |
|---|---|
| Previous Daily High | 17.8405 |
| Previous Daily Low | 17.7403 |
| Previous Weekly High | 18.0780 |
| Previous Weekly Low | 17.7459 |
| Previous Monthly High | 18.4018 |
| Previous Monthly Low | 17.9329 |
| Daily Fibonacci 38.2% | 17.8022 |
| Daily Fibonacci 61.8% | 17.7786 |
| Daily Pivot Point S1 | 17.7440 |
| Daily Pivot Point S2 | 17.6920 |
| Daily Pivot Point S3 | 17.6438 |
| Daily Pivot Point R1 | 17.8442 |
| Daily Pivot Point R2 | 17.8925 |
| Daily Pivot Point R3 | 17.9445 |
[/s2If]
Nehcap Expert Advisor
The NEHCAP MT4 EA is high quality professional trading system geared to generate returns without using GRID or martingales. Each trade has strict risk per trade parameter. The pairs under management include EURUSD, GBPUSD, AUDCAD, AUDNZD,GBPAUD, EURAUD, EURCAD, CHFJPY and many more.
The system is trading live: LIVE ACCOUNT TRACKING
You can run it free. Apply for a free trial and track our account. Buy the system or use profit share mechanism to generate returns on your MT4.
Join Our Telegram Group
")


