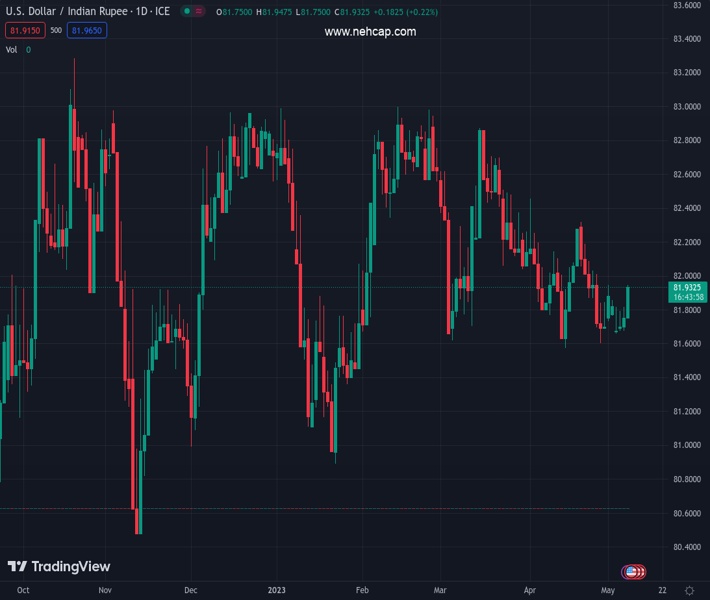
#USDINR @ 81.9400 has added significant gains amid a strong recovery in the USD Index ahead of US inflation. (Pivot Orderbook analysis)
…
This is a premium post.
[s2If !current_user_can(access_s2member_level4)]Please register for FREE REGISTER to read full post below containing analysis. In case of any error or you think you are not able to read the full post below, please email us at support#nehcap.com [lwa][/s2If] [s2If current_user_can(access_s2member_level1)]
- USD/INR has added significant gains amid a strong recovery in the USD Index ahead of US inflation.
- The Fed is expected to keep interest rates higher for a longer period to continue to weigh on stubborn US inflation.
- USD/INR has attempted a confident breakout of the consolidation formed in an 81.64-81.95 range.
The pair currently trades last at 81.9400.
The previous day high was 81.914 while the previous day low was 81.669. The daily 38.2% Fib levels comes at 81.8204, expected to provide support. Similarly, the daily 61.8% fib level is at 81.7626, expected to provide support.
The USD/INR pair has shown a perpendicular run after opening towards the critical resistance of 82.00 in the Asian session. The major has witnessed a significant buying interest as investors have discounted overnight gains in the US Dollar Index (DXY) propelled amid uncertainty over the release of the United States inflation data, which will release on Wednesday.
The USD Index has shown a mild correction after a firmer recovery to near 101.50. Investors have pumped funds into the USD Index as the Federal Reserve (Fed) is expected to keep interest rates higher for a longer period as US inflation is critically stubborn.
On the Indian Rupee front, global credit rating firm Fitch has affirmed India’s Long-Term Foreign-Currency Issuer Default Rating (IDR) at ‘BBB-‘ with a stable outlook. Global rating firm is confident about the resilient outlook, being an attractive destination for FDIs and FIIs.
USD/INR has attempted a confident breakout of the consolidation formed in an 81.64-81.95 range on a two-hour scale. A breakout of the Darvas Box results in wider ticks and heavy volume due to an expansion in volatility.
The 20-period Exponential Moving Average (EMA) at 81.78 is providing a cushion to the US Dollar bulls.
Meanwhile, the Relative Strength Index (RSI) (14) has climbed into the bullish range of 60.00-80.00, solidifying more upside ahead.
USD/INR can be bought at the current price for an upside toward April 26 high at 82.12. A breach of April 26 high will result in more upside toward April 21 high at 82.30.
On the contrary, a breakdown of the consolidation range below 81.60 will expose the asset to April 14 low at 81.50 followed by 26 January low at 81.36.
Technical Levels: Supports and Resistances
USDINR currently trading at 81.952 at the time of writing. Pair opened at 81.787 and is trading with a change of 0.2 % .
| Overview | Overview.1 | |
|---|---|---|
| 0 | Today last price | 81.952 |
| 1 | Today Daily Change | 0.165 |
| 2 | Today Daily Change % | 0.200 |
| 3 | Today daily open | 81.787 |
The pair is trading above its 20 Daily moving average @ 81.8908, below its 50 Daily moving average @ 82.0912 , below its 100 Daily moving average @ 82.1812 and above its 200 Daily moving average @ 81.6407
| Trends | Trends.1 | |
|---|---|---|
| 0 | Daily SMA20 | 81.8908 |
| 1 | Daily SMA50 | 82.0912 |
| 2 | Daily SMA100 | 82.1812 |
| 3 | Daily SMA200 | 81.6407 |
The previous day high was 81.914 while the previous day low was 81.669. The daily 38.2% Fib levels comes at 81.8204, expected to provide support. Similarly, the daily 61.8% fib level is at 81.7626, expected to provide support.
Note the levels of interest below:
- Pivot support is noted at 81.6661, 81.5451, 81.4211
- Pivot resistance is noted at 81.911, 82.035, 82.156
| Levels | Levels.1 |
|---|---|
| Previous Daily High | 81.9140 |
| Previous Daily Low | 81.6690 |
| Previous Weekly High | 81.9525 |
| Previous Weekly Low | 81.6435 |
| Previous Monthly High | 82.5092 |
| Previous Monthly Low | 81.4850 |
| Daily Fibonacci 38.2% | 81.8204 |
| Daily Fibonacci 61.8% | 81.7626 |
| Daily Pivot Point S1 | 81.6661 |
| Daily Pivot Point S2 | 81.5451 |
| Daily Pivot Point S3 | 81.4211 |
| Daily Pivot Point R1 | 81.9110 |
| Daily Pivot Point R2 | 82.0350 |
| Daily Pivot Point R3 | 82.1560 |
[/s2If]
Nehcap Expert Advisor
The NEHCAP MT4 EA is high quality professional trading system geared to generate returns without using GRID or martingales. Each trade has strict risk per trade parameter. The pairs under management include EURUSD, GBPUSD, AUDCAD, AUDNZD,GBPAUD, EURAUD, EURCAD, CHFJPY and many more.
The system is trading live: LIVE ACCOUNT TRACKING
You can run it free. Apply for a free trial and track our account. Buy the system or use profit share mechanism to generate returns on your MT4.
Join Our Telegram Group
")


